
The Diagnostics component is used to view and download any debugging information from the system such as core dumps, log files, traffic captures, etc. needed to diagnose and debug system issues.
Launch the Diagnostics features by navigating to LIVE MONITOR > Diagnostics as shown below:
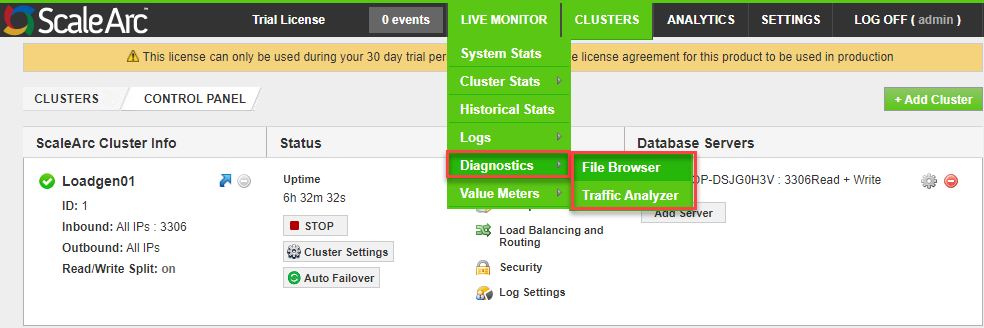
The Diagnostics menu has two components namely:
- File Browser
- The File Browser screen displays various logs and files from the system to diagnose system issues.
- Traffic Analyzer
- The Traffic Analyzer tool analyzes the SQL traffic captured between your application and database server. Use this feature to analyze the nature of traffic and load on the database servers and to help identify the areas where queries can be fine-tuned for optimum performance.