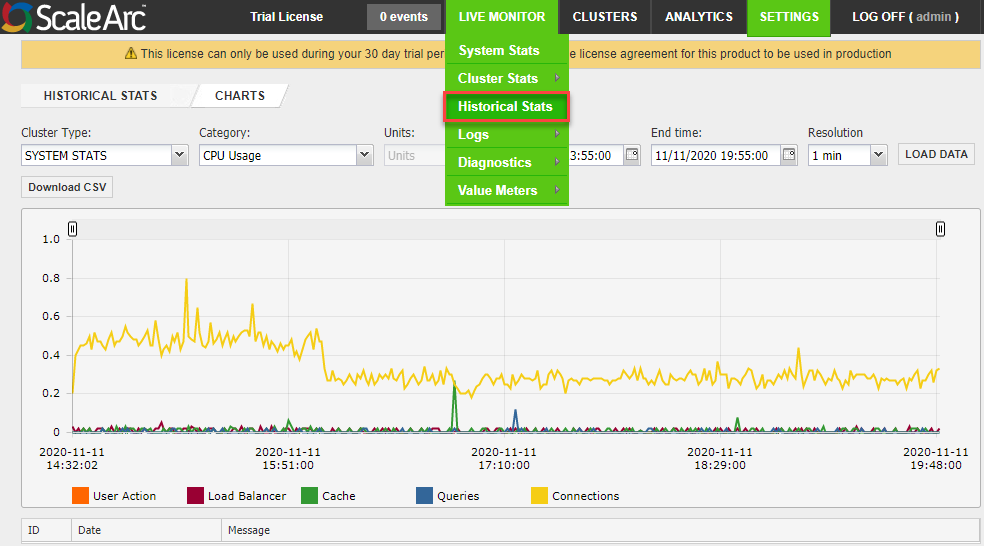
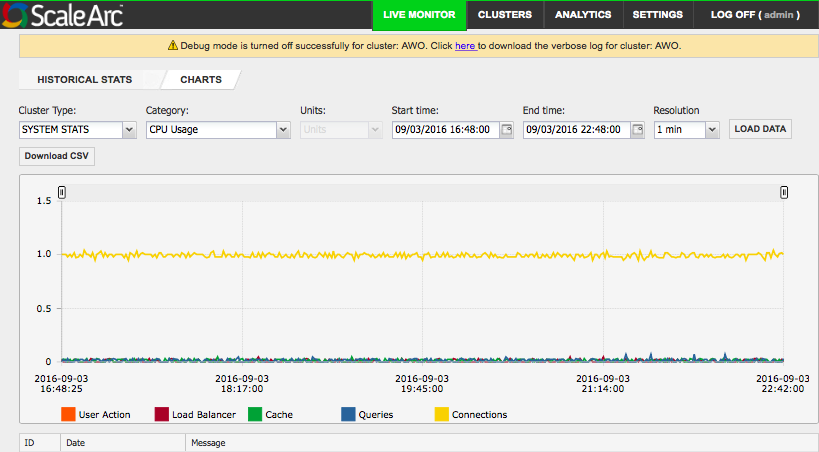
The Historical Stats screen under the Live Monitor menu gives you a look into the historical performance properties of the system or the cluster. This is very useful for analyzing and troubleshooting system behavior.
For a system or an individual cluster, choose a category to load the data associated with your selection. The resulting graphical display includes one or more data types. You can toggle on/off the legend corresponding to a specific data type to isolate and review behavior.
Follow these steps to load the Historical Stats data for viewing:
- Click on the LIVE MONITOR menu > Historical Stats on the ScaleArc dashboard.

- Select a Cluster Type, Category, Units, Date Range, and Resolution from the respective drop-downs. Click LOAD DATA.

-
Toggle a legend below the graph to show or remove a data type on the graph.
Graph Description Legend User input Cluster Type Can list systems or individual clusters.
Displays historical information for Client/Server Connections, Cache Usage, Query/Second, Cache Hit Rate, Queries Count per Server, and Cache Usage per DB.
Select System or an individual cluster from the drop-down. Category Select a category. If you have selected a cluster, see Cluster stats for a description of each category. CPU Usage Graph Shows the real-time CPU usage of the selected system or clusters on ScaleArc.
Load balancer
Cache
Queries
ConnectionsToggle the legend to show or hide a data type from the graph. Bandwidth Usage Graph Shows the network bandwidth usage (in MB/s or GB/s) for the system or cluster traffic on the ScaleArc appliance.
Inbound Outbound Toggle the legend to show or hide a data type from the graph. Cache Usage Graph Shows the cache used by the system or cluster on the ScaleArc appliance.
Cache size Toggle the legend to show or hide a selected data type from the graph. Client/Server Connection Graph Shows the number of network connections of different types on the system or cluster.
Client Server Read Q Write Q Persistent client Error Thick Toggle the legend to show or hide a selected data type from the graph. Query/Second Graph Shows the real-time throughput of queries in the clusters or system.
Read Write Block Error Thick Toggle the legend to show or hide a selected data type from the graph. MP Stats Shows the processors related statistics. See mpstat for more details.
User System IO Wait Idle Toggle the legend to show or hide a selected data type from the graph. VM Stats Shows the virtual memory statistics of the system. See vmstat for more details. Free Buffer
CacheToggle the legend to show or hide a selected data type from the graph. Units In Mb or Gb, depending on the data rate. Select a unit, if applicable. Start date The start date for the graph. Select a date. End date The end date for the graph. Select a date. Resolution Shows the graph over the selected time. Choose a resolution time from the drop-down menu. ID The itemized list. Date The date on which activity occurred for the selected system or cluster. Message Describes the user activity related to a selected system or cluster.