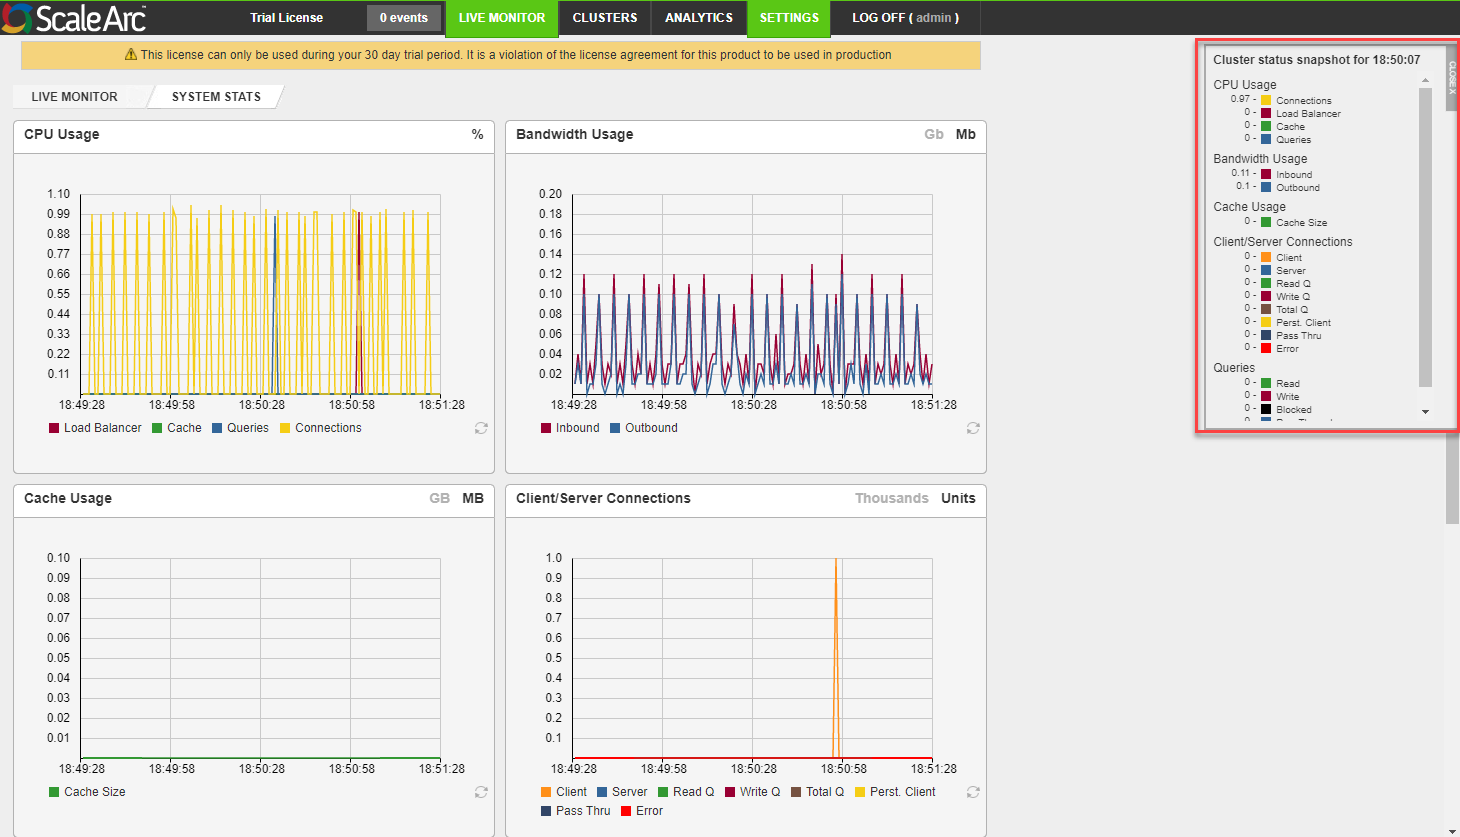
The System Stats screen includes information about the ScaleArc system itself. Graphical representations show CPU Usage, Bandwidth Usage, Cache Usage, Client/Server Connections, and Queries, per query type.
Follow these steps to view the System Stats screen and interpret system health:
- Click the LIVE MONITOR menu > System Stats on the ScaleArc dashboard.
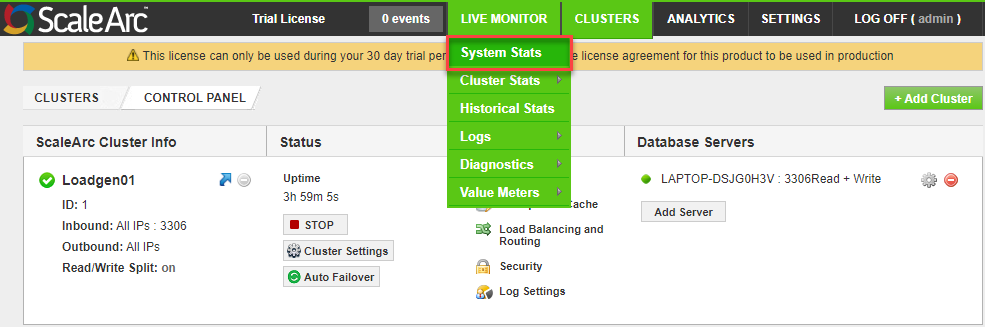
-
Review the screen for system health.
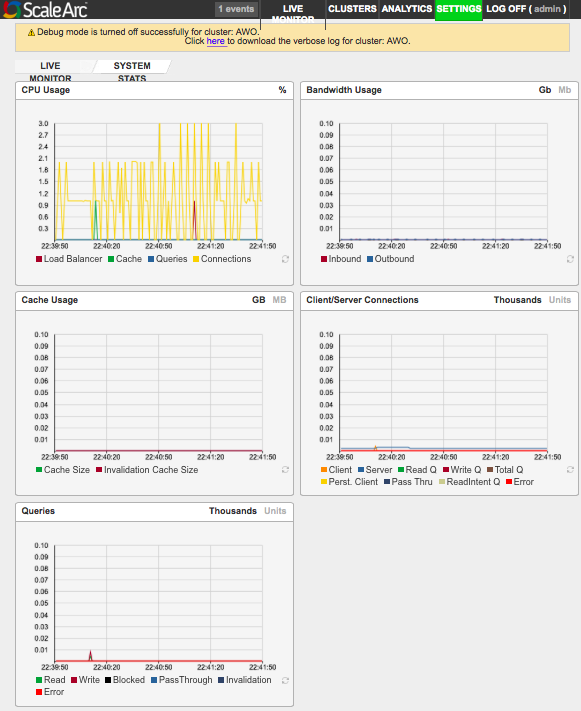
Refer to this table for interpretation of the above graphs.
| Graph | Description | Default/User input | |||||
|---|---|---|---|---|---|---|---|
| 1 | CPU Usage |
Shows the PERCENTAGE of real-time CPU usage of the different ScaleArc processes on the ScaleArc appliance. |
Click on one or more of the toggle buttons below the live chart to see the percentage of usage for the selected component(s). | ||||
| 2 | Bandwidth Usage |
Shows the real-time network bandwidth usage, in MBs or GBs, for both inbound and outbound traffic on the ScaleArc appliance. |
|
||||
| 3 | Cache Usage |
Shows the real-time memory cache usage in MBs or GBs on the ScaleArc appliance. |
|
||||
| 4 | Client/Server Connections |
Shows the number of network connections of different types on the ScaleArc appliance. |
|
||||
| 5 | Queries |
Shows the real-time throughput of queries on the ScaleArc appliance, based on the different query types. |
|
Clicking on any of the graphs will show the Cluster status snapshot for the five metrics at the given time.