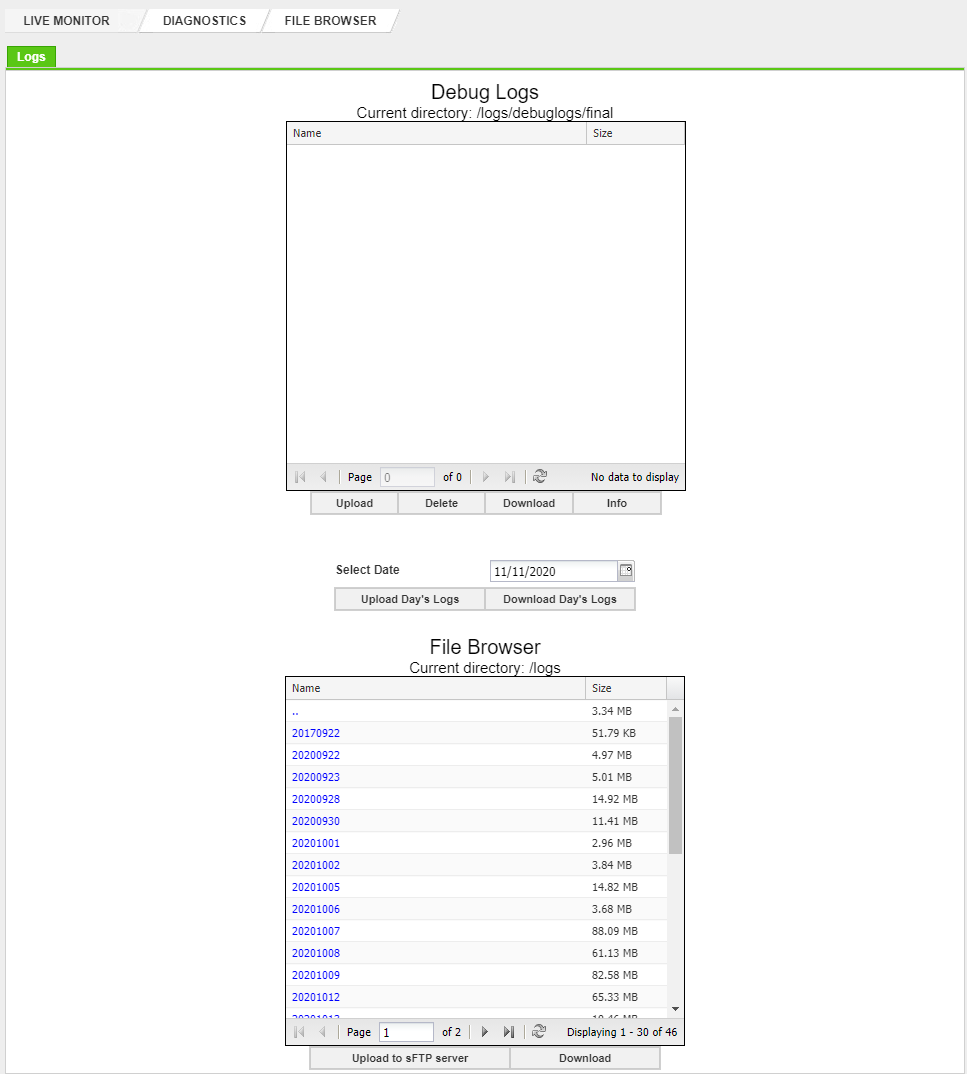
The File Browser screen displays various logs from the system such as core dumps, debug log files, and so on, useful for diagnosing system issues. Use the screen to review and/or download various debug logs.

Debug logs
The Debug Logs records database operations, system processes, and errors that occur during operation. It is a valuable tool for any system administrator.
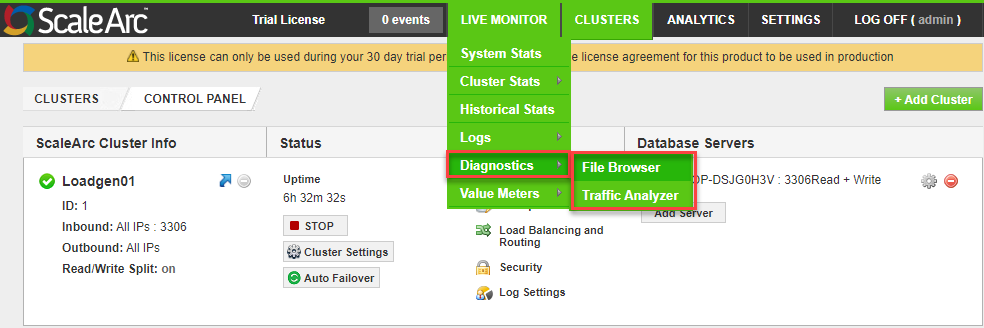
- Click on the LIVE MONITOR menu > Diagnostics > File Browser on the ScaleArc dashboard to open the Logs screen.

You can perform various actions from this screen as outlined below:
Download debug logs
Whenever ScaleArc crashes, it collects the required files and creates a tar file that can you can use for analysis. Access this file in the Debug Logs section when a system crash occurs.

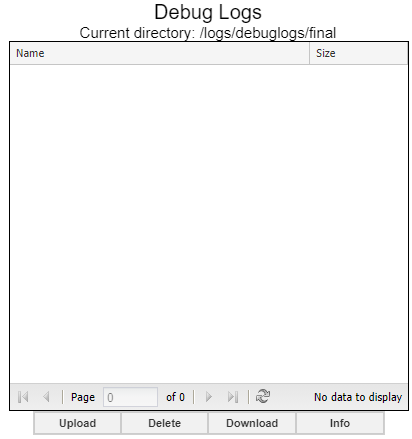
In the event of a crash, the debug log is generated and the various buttons are activated for the following actions:
- Click Upload to upload the file to the sFTP server.
- Click Delete to remove the file from ScaleArc.
- Click Download to save the file to your local machine. This file provides the details on the crash.
- Click Info to view a stack trace of the selected crash file.
Further to the debug logs, ScaleArc generates daily logs of all activities. You can perform the various actions below for a particular day's logs:

Upload Day's Logs
- Select a date from the drop-down menu.
- Click Upload Day's Logs to upload the logs to the sFTP server.
Download Day's Logs
- Select a day from the drop-down menu.
- Click Download Day's Logs to download the logs to your local machine.
File Browser
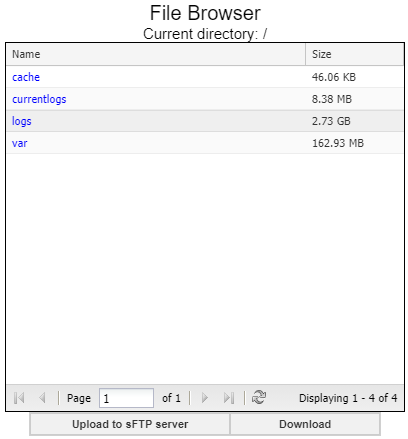
The File Browser section lets you browse and download files from the following four directories:
- cache
- currentlogs
- logs
- var

You can perform these actions for a particular file:
Upload to sFTP server
- Select a file from the directory.
- Click Upload to sFTP server.
Download a file
- Select a file from the directory.
- Click Download to download the selected file to your local machine.