
Applications communicate with the database server by exchanging SQL queries and responses. The ScaleArc Traffic Analyzer tool helps you analyze the SQL traffic captured on the wire between your application and database server. It gives you a profile of the traffic pattern, which can then be used to fine-tune the ScaleArc appliance for optimum performance.
The Traffic Analyzer feature is divided into two functional modules:
Traffic Capture
Follow these steps to use the Traffic Capture utility for capturing network-level SQL traffic passing through the ScaleArc appliance for analysis.
- On the ScaleArc dashboard click on LIVE MONITOR > Diagnostics > Traffic Analyzer.
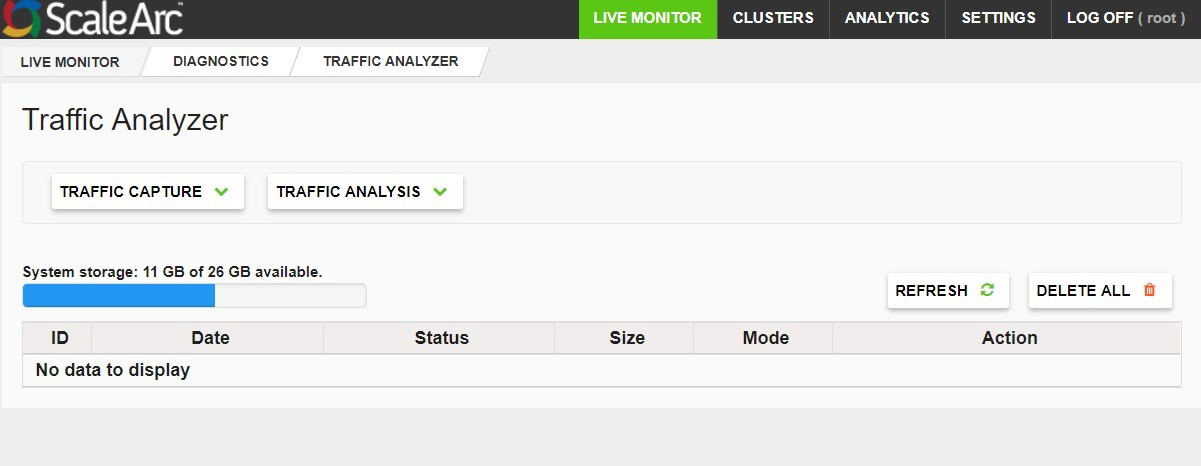
- Click TRAFFIC CAPTURE to select the parameters for capturing network traffic.
- Configure General Options for capturing traffic, starting by choosing a Mode to capture the traffic.
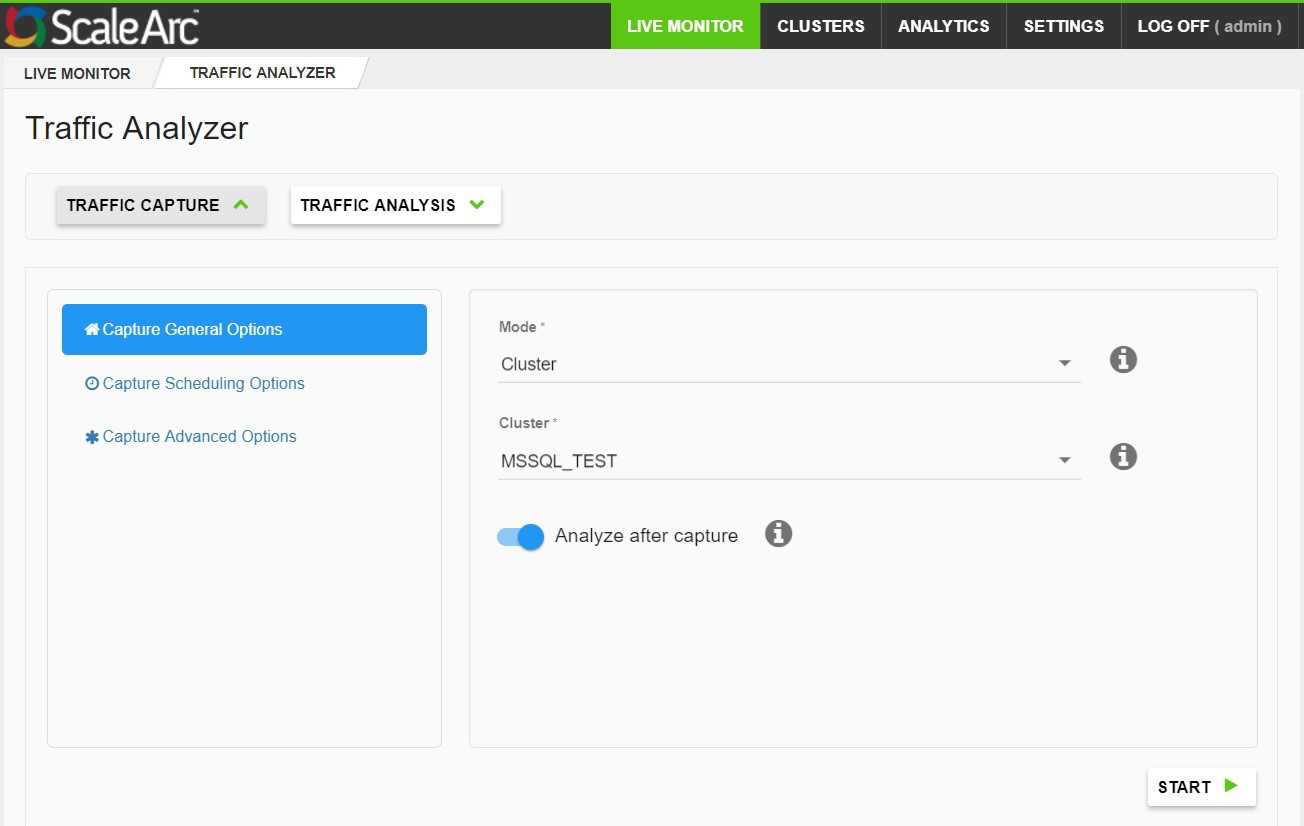
Configure parameters as follows:
Field
Description
Default/user input
Mode Mode to capture traffic. Select either Cluster or Host and Port. Choose Cluster or Host and Port. Cluster The cluster name. Select a cluster. Host The hostname. Enter hostname. TCP port The TCP port. Enter the TCP port number for which you want to capture the data. Analyze after capture Enable/disable traffic analysis of the captured traffic data. Use the toggle to ENABLE/DISABLE traffic analysis on captured data traffic. Start Begin capturing the traffic data. -
Click on Capture Scheduling Options to select the preferred scheduling method, which can either be by Duration in seconds or by Number of files.
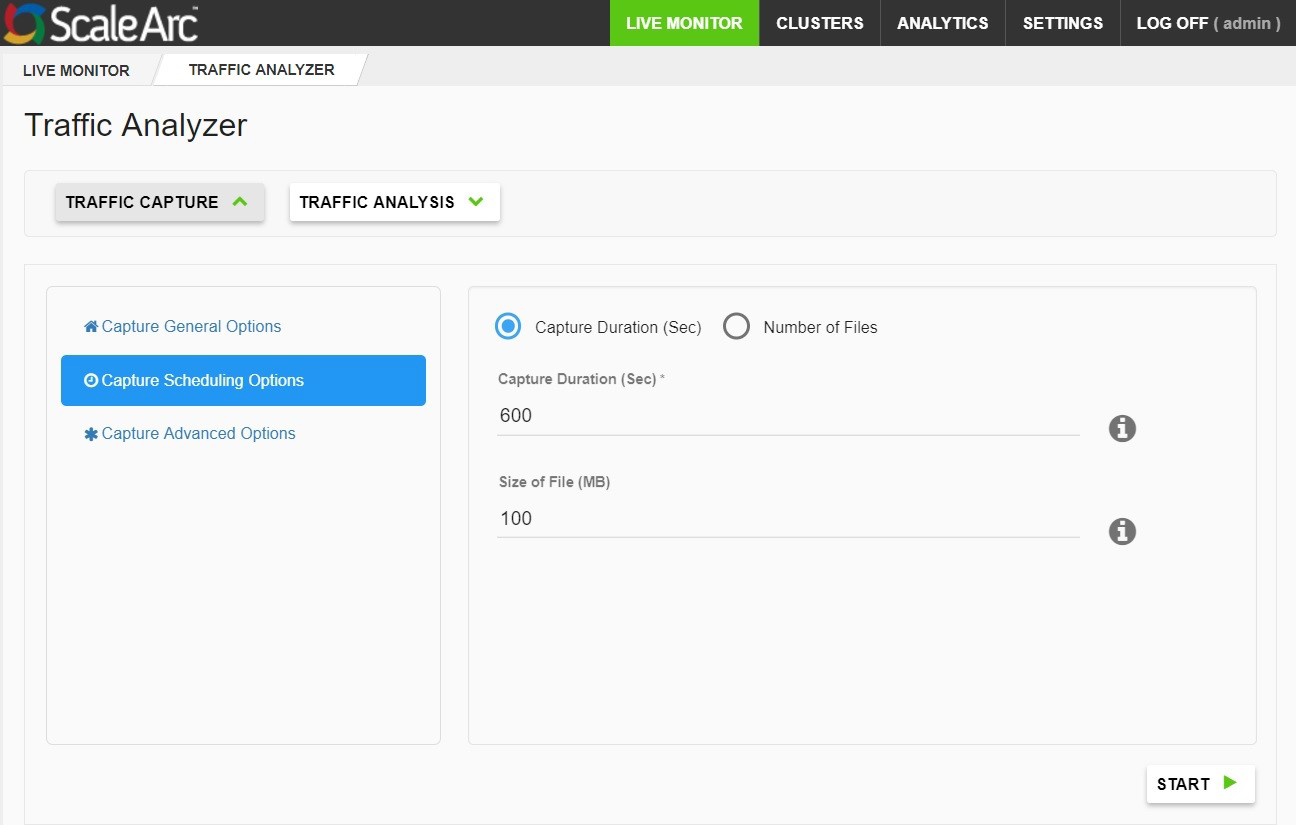
If you select Capture Duration then configure the following parameters:
Field
Description
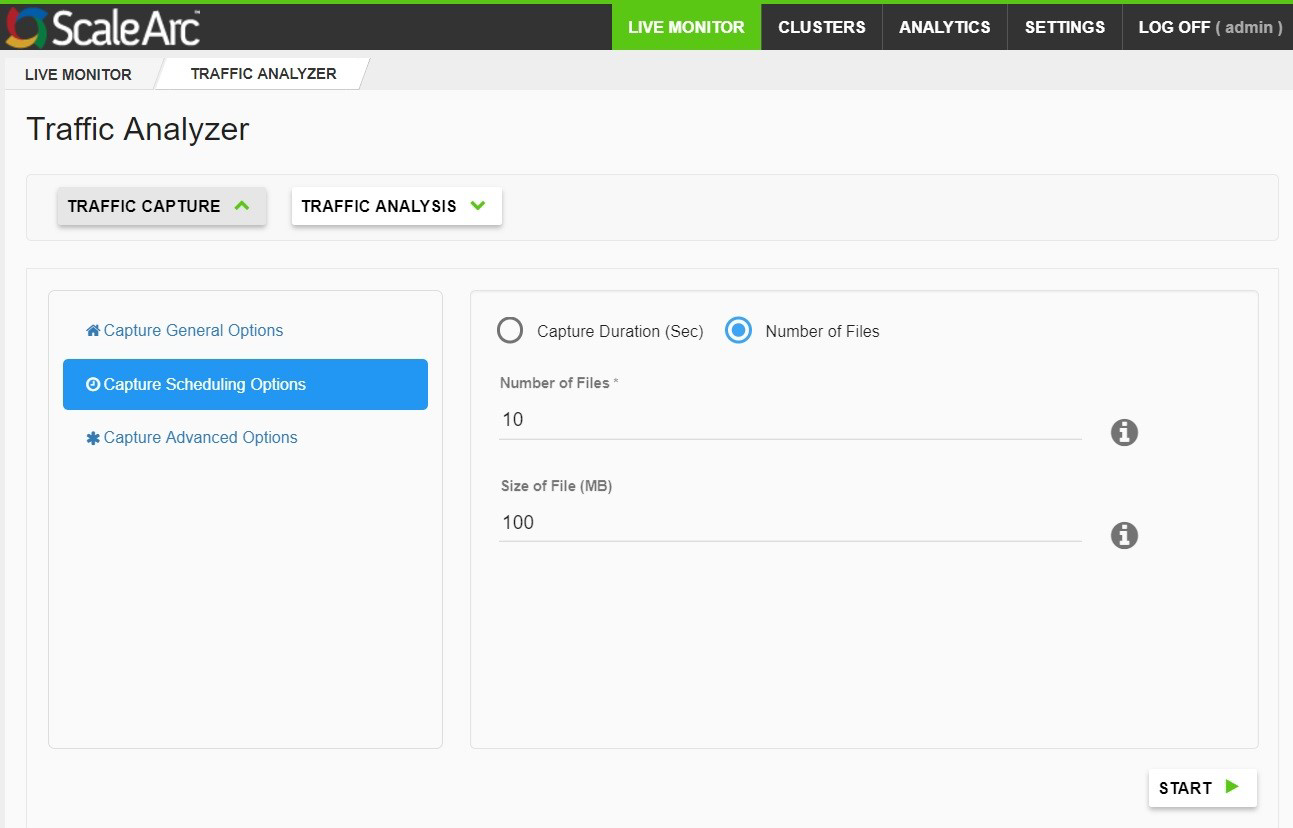
Capture Duration (sec) Define the maximum duration of the traffic capture to record data in seconds (1-86,400). The creation of the tcpdump file is stopped automatically once the maximum duration has been reached even if the size of the file specified has not been reached. Size of File (MB) Define the maximum size (MB) of the tcpdump file captured. Each file that is captured is limited to the size specified here. If you select Number of Files then configure the following parameters:
Field
Description
Number of Files Enter the number of files to be captured (1-100). The creation of the tcpdump files is stopped automatically once the maximum number of files has been reached. Size of File (MB) Define the maximum size (MB) of the tcpdump file captured. The creation of the tcpdump file is stopped automatically once the maximum file size has been reached. -
Click on Capture Advanced Options to configure additional parameters.
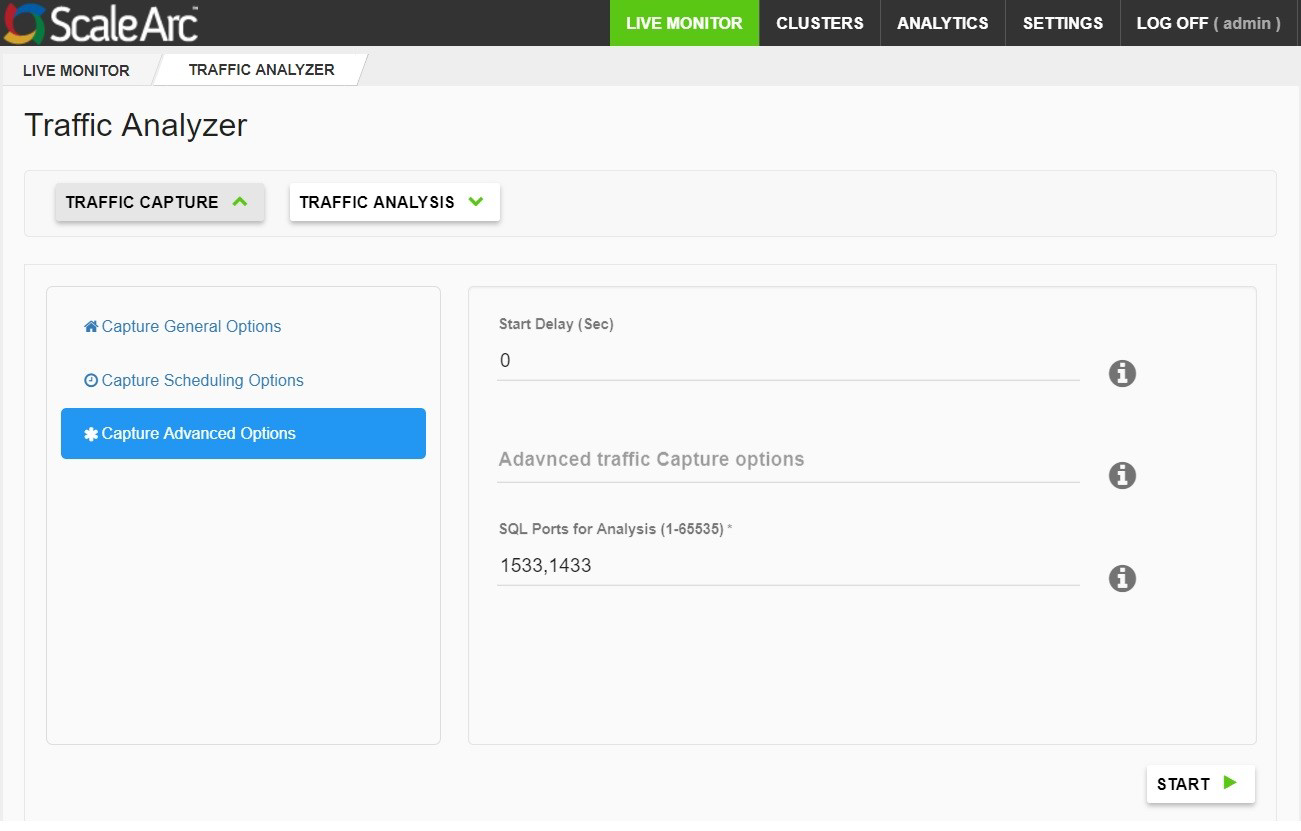
Field
Description
Start Delay (Sec) Enter the duration in seconds (1-3600) before the traffic capturing utility begins recording data. Advanced traffic capture options Enter advanced options for the traffic utility to record data. Refer to the TCPDUMP man page for information on configuring advanced traffic capture options. SQL ports for analysis (1-65535) Enter additional comma-separated ports for analysis. Traffic Analysis
Use the TRAFFIC ANALYSIS option to analyze and generate reports from the captured data,
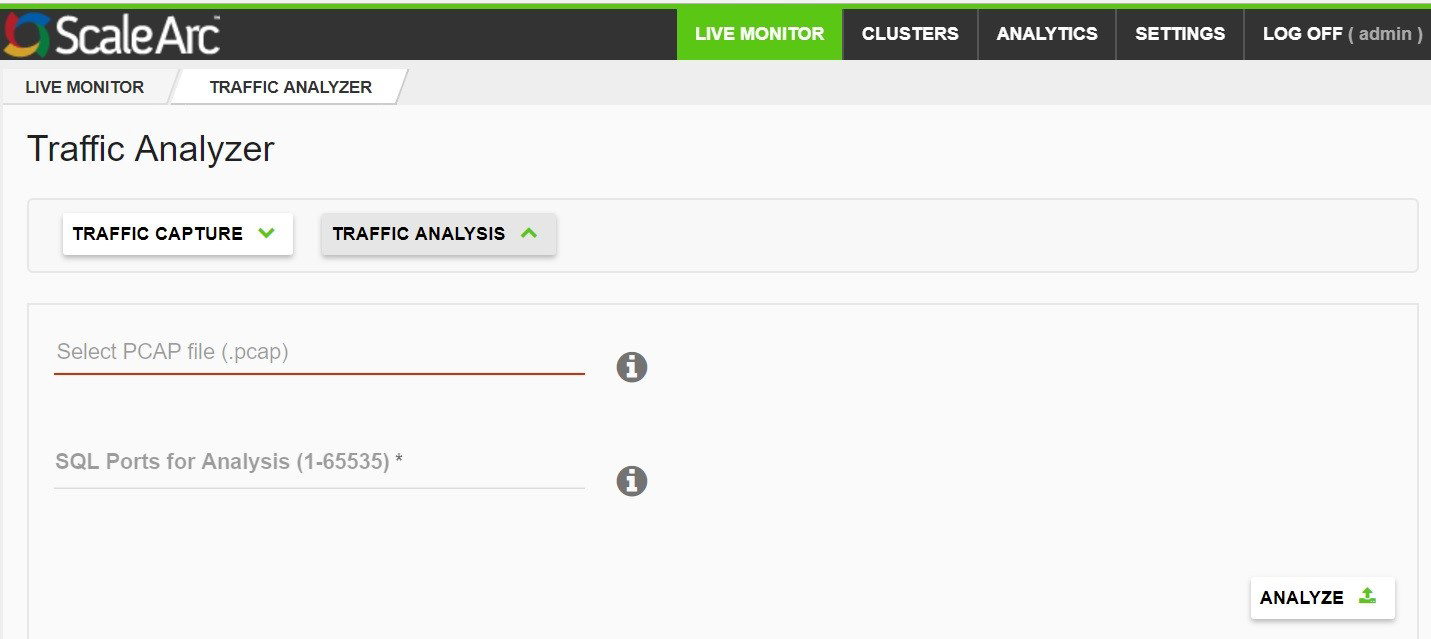
Configure parameters as follows:
Field
Description
Select PCAP file Upload PCAP (.pcap, .cap, etc) file for analysis. SQL Ports for Analysis Enter additional comma-separated ports (1-65535) for analysis. Analyzing Records
Once the file is analyzed a record is created.
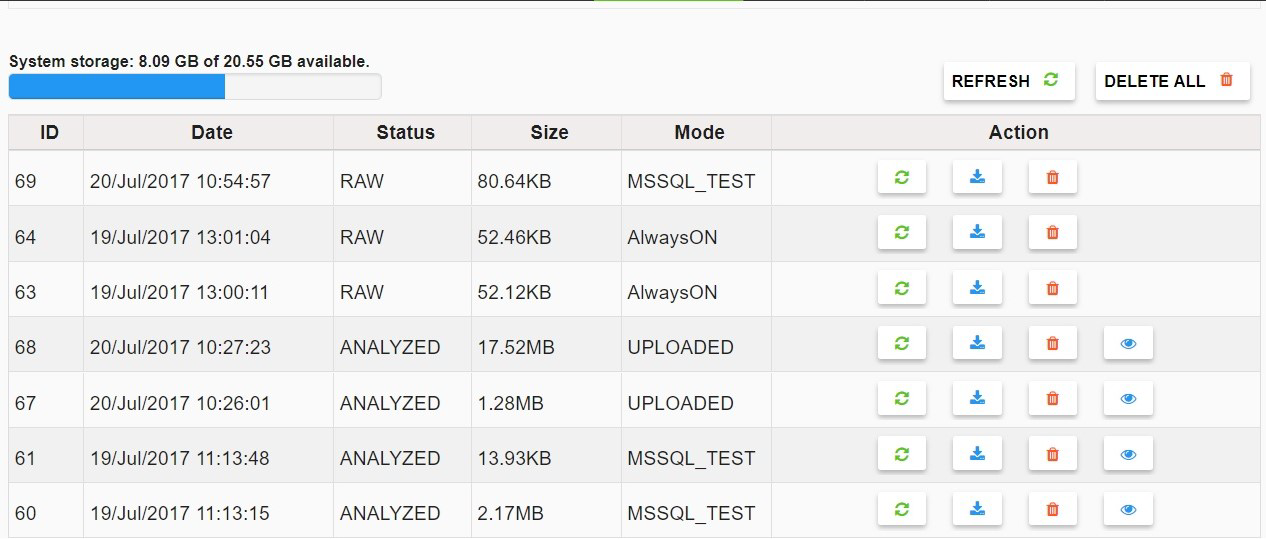
Field
Description
Default/user input
System Storage The system storage used and available. Refresh Refreshes the list of records. Click to refresh the record list. Delete ALL Deletes all the reports generated. Click to delete all the reports. ID The number associated with a report. Date The date and time the report was created. Status The status of the record. Size The size of the record. Mode Displays the mode used to capture the traffic, either cluster name or host IP and port number. Action Icons provide options to analyze, download, delete and view the report. Click on an icon to perform the related action. View a Report
Click on the view icon (eye) then select a file to open from the drop-down list.
Click on Traffic Analyzer Report details for more information on the report generated by the traffic analyzer tool.
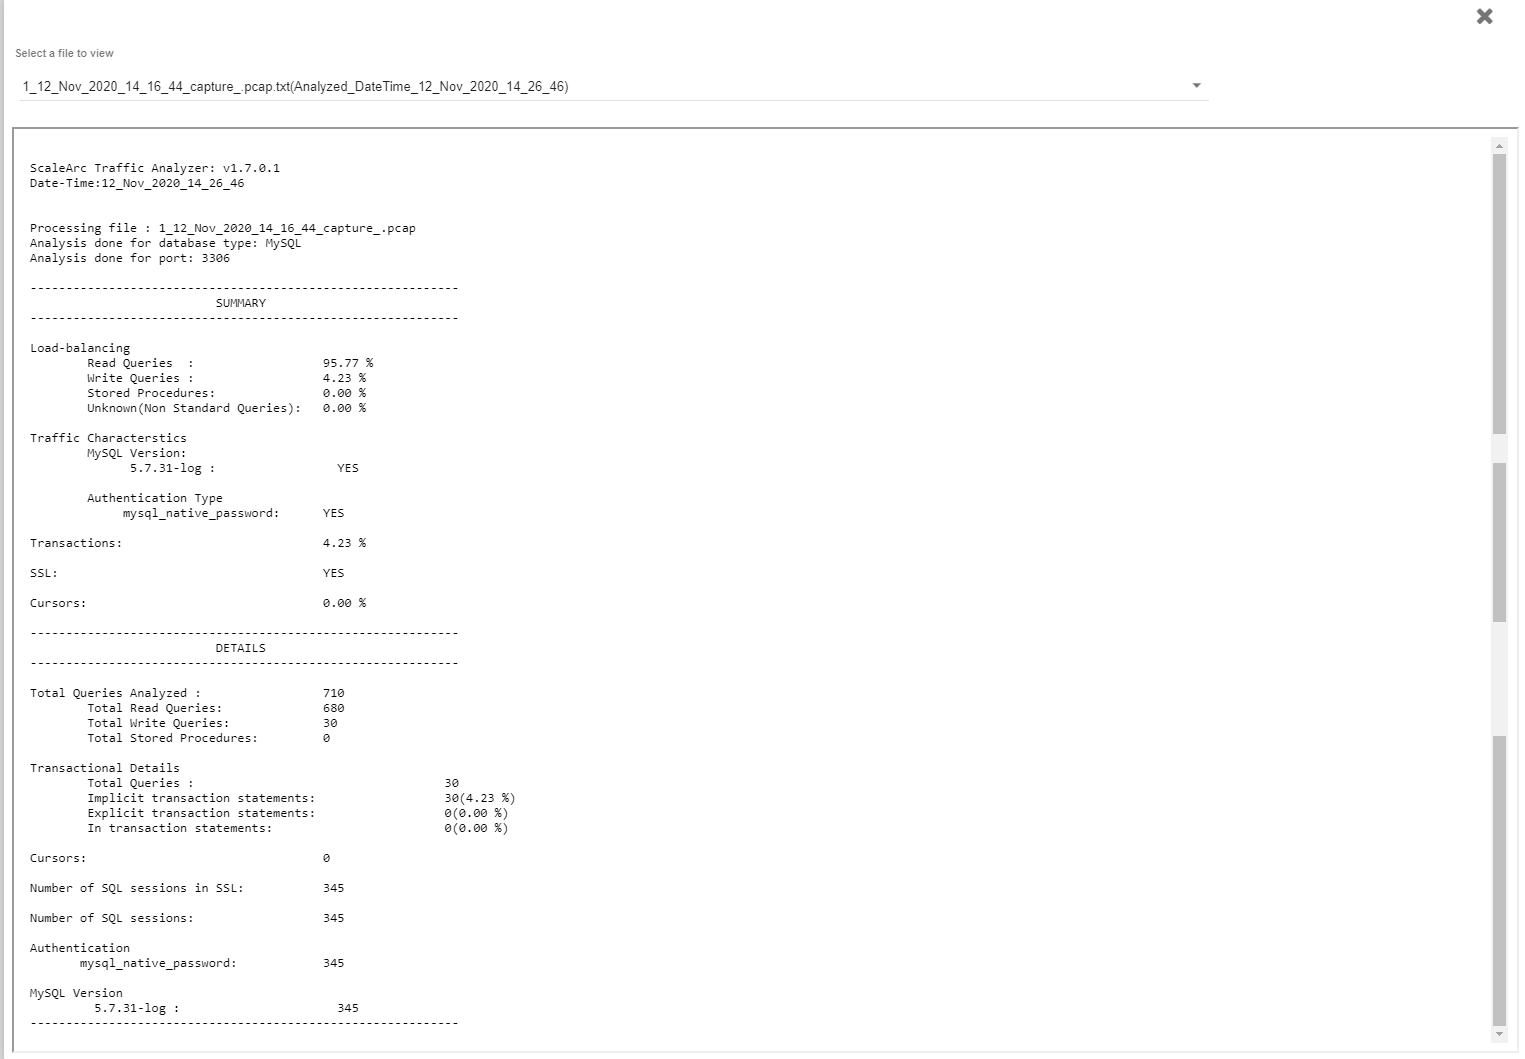
Traffic Analyzer Report details
The Traffic Analyzer Report displays the statistical summary of SQL traffic such as read/write queries, queries in transactions, SQL version, etc. Additional information on SSL connections, MySQL traffic session count, traffic bifurcation in transactions can also be viewed.
A sample report is provided below for reference.
ScaleArc Traffic Analyzer: v1.7.0.1
Date-Time:27_Sep_2017_08_00_56


Processing file : 85_upload_27_Sep_2017_07_58_39_handover.pcap
Analysis done for database type: MySQL
Analysis done for port: 3306

------------------------------------------------------------
                          SUMMARY
------------------------------------------------------------

Load-balancing
        Read Queries  :                  59.27 %
        Write Queries :                  40.73 %
        Stored Procedures:               0.00 %
        Unknown(Non Standard Queries):   0.00 %

Traffic Characterstics
        MySQL Version:
              5.5.15 :                 YES

        Authentication Type
             mysql_native_password:      YES

Transactions:                            10.26 %

SSL:                                     NO

Cursors:                                 0.00 %

------------------------------------------------------------
                          DETAILS
------------------------------------------------------------

Total Queries Analyzed :                 604
        Total Read Queries:              358
        Total Write Queries:             246
        Total Stored Procedures:         0

Transactional Details
        Total Queries :                                   62
        Implicit transaction statements:                  0(0.00 %)
        Explicit transaction statements:                  62(10.26 %)
        In transaction statements:                        0(0.00 %)

Cursors:                                 0

Number of SQL sessions in SSL:           0

Number of SQL sessions:                  92

Authentication
       mysql_native_password:            82
       Undetermined Authentication:      10

MySQL Version
         5.5.15 :                      82
------------------------------------------------------------