The Log Trail screen provides a real-time view into every query and session that is established to and through ScaleArc.
Follow these steps to locate and view various ScaleArc Logs, aggregated by each cluster:
-
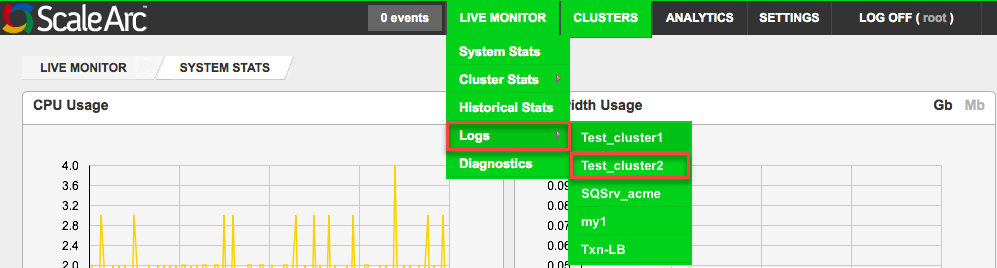
Click the LIVE MONITOR menu > Logs > [cluster name] on the ScaleArc dashboard to view the Logs for the specified cluster.
 Tip: Logs can also be easily accessed through the cluster quick links located next to the cluster name on the ScaleArc Control Panel.
 -
Different Log types will be displayed on separate tabs as shown. Check the table below for an explanation of the various log types.
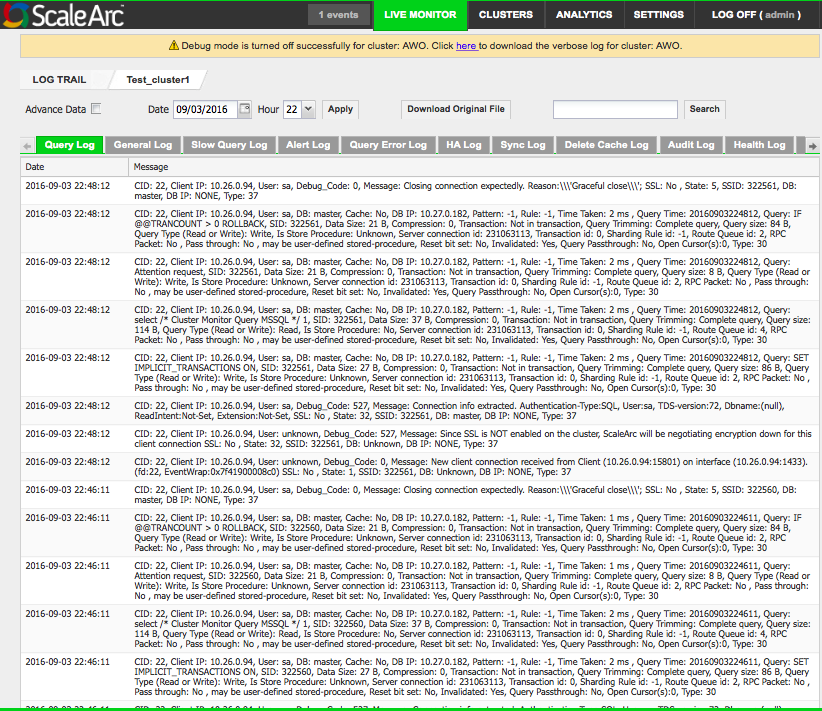
Log Description Query Log Captures all client connections (applications) and SQL statements run against any database server in the cluster. The query log is useful when you suspect an error from a client and want to know exactly what the client or application sent to the database server.
General Log Contains API status collection information regarding the health of the Scalearc core.
Slow Query Log Slow Query Log – The slow query log includes all queries which take longer than the configured time to process on your servers. You could use this log to find out which queries are most intensive, optimize them, or cache the frequently repeated ones to reduce load. Slow query logs are disabled by default. Refer to Log settings for details.
Alert Log Includes log messages from ScaleArc that require the attention of the system administrator, for example. database health check failure alerts.
Query Error Log Includes log messages from ScaleArc where either there is an error processing the query on the server; in which case it logs the error message returned from the server. Alternatively, it indicates an internal error.
HA Log Includes log messages from ScaleArc's HA service.
Sync Log Includes log messages from the rsync service that is syncing resources between the HA pair.
Delete Cache Log Includes messages when cache data is deleted. These messages are seen only for scheduled cache deletes. Refer to Cache Manager for more information.
Audit Log Contains an audit trail for UI changes performed on ScaleArc for a given cluster. This includes which user made a change and what change was made to the system.
Health Log Includes messages related to the health of the database servers.
Auto Failover Log Includes messages related to the status of Autofailover.
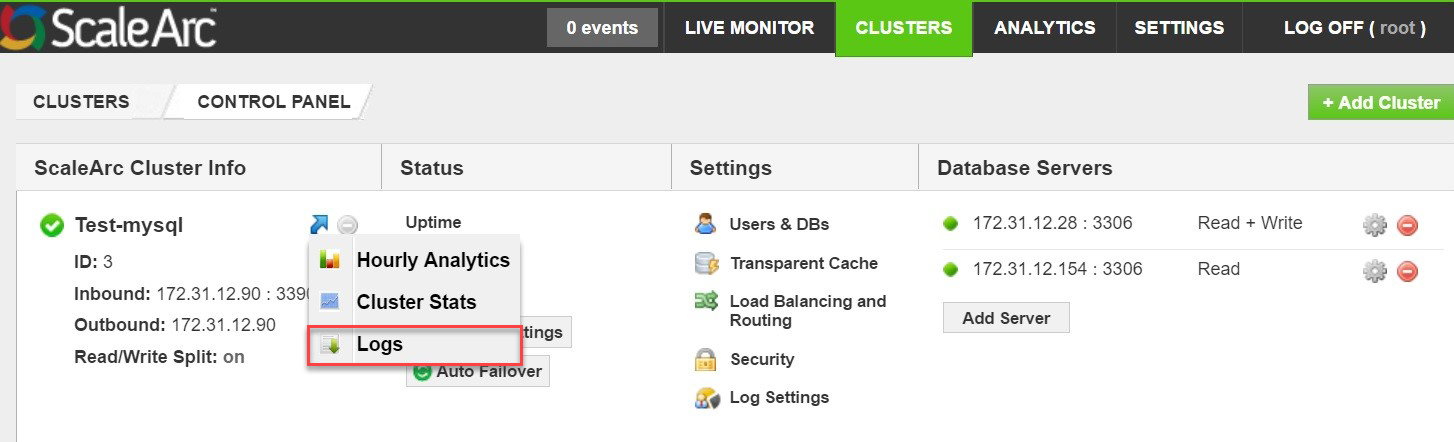
Cluster Quick Links
You can also access the Logs through the cluster Quick Links.
Click on the blue arrow in the ScaleArc Cluster Info column on the cluster control panel for quick links to hourly analytics, cluster statistics, and logs.
Detailed steps:
- Click on the CLUSTERS menu on the ScaleArc dashboard.
- Locate the ScaleArc Cluster Info column.
- Hover on the blue arrow next to the cluster name and select Logs on the pop-up menu as shown below: