
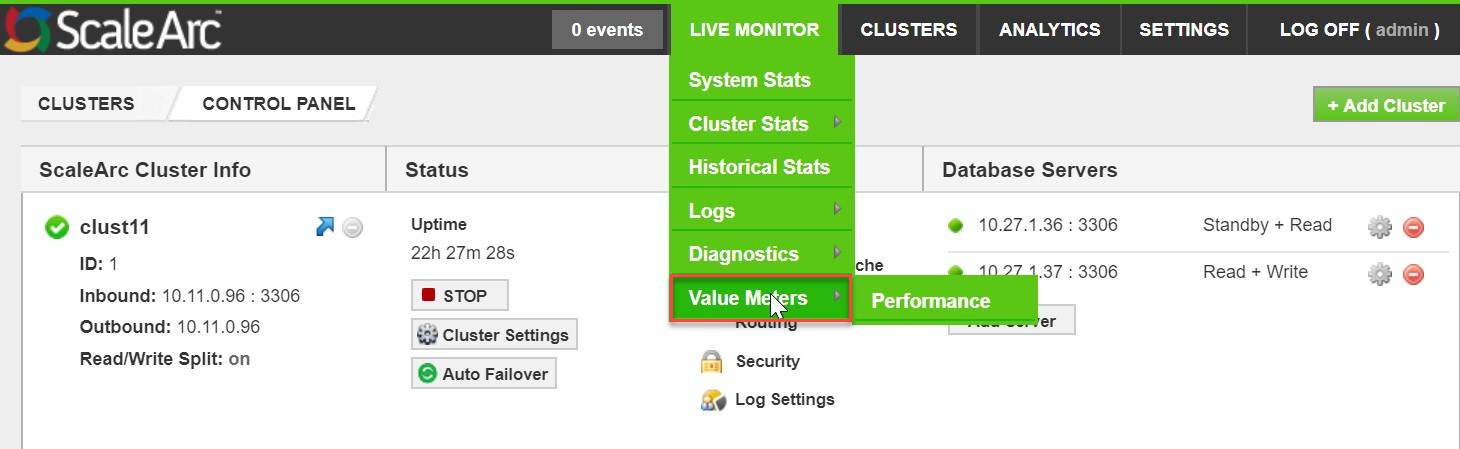
The Value Meters screen accessed from the Live Monitor menu displays the value added by ScaleArc to a customer's environment in one of two ways:
- It measures queries per second (QPS) to show performance per customer application against a ScaleArc cluster.
- It is designed to run multiple times to generate empirical data on performance per application when leveraging the ScaleArc appliance. For example, with the Read/Write split within transactions feature turned ON for the cluster, run the Value Meter to assess performance.
Note:
- You need to send traffic through ScaleArc in order for the Value Meter to display performance results. Use tools such as Sysbench or ScaleArc LoadGen to generate traffic; alternatively, use live traffic.
- To capture and download cluster traffic logs use the Verbose Debug Mode feature.
The current release of ScaleArc provides one option under the Value Meters menu, which is described below.
Performance
The Performance screen is a valuable tool for any system administrator to measure application performance. It compares and displays traffic performance in QPS with and without ScaleArc.
Use the screen to view performance for a selected cluster by following these steps:
- On the ScaleArc dashboard click on LIVE MONITOR > Value Meters > Performance.
-
Before beginning the test make sure traffic is running through your cluster on ScaleArc.
-
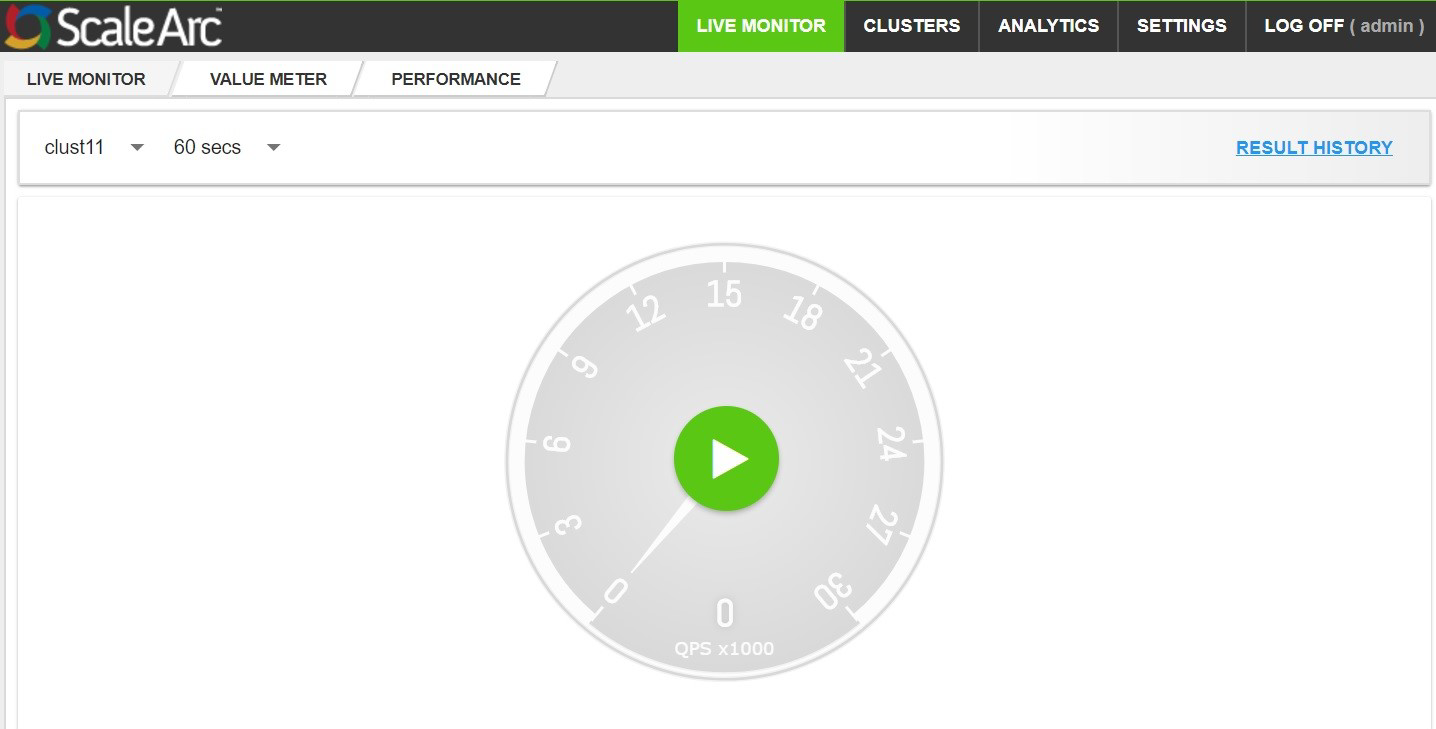
Select the cluster and duration for running the test. For example, select clust1 for the cluster and 60 seconds as the duration for running traffic then click on the play icon at the center of the traffic dial to begin.
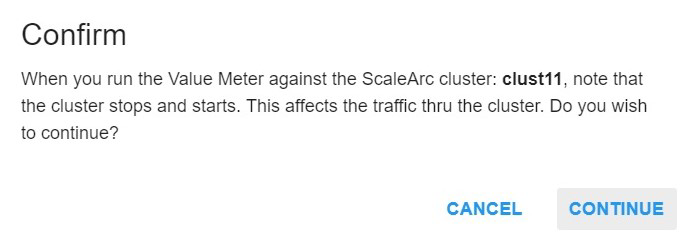
- Click CONTINUE when prompted to confirm if you wish to capture traffic, otherwise select CANCEL if you don't wish to proceed.
-
The cluster restarts at this point. Now the cluster is in a passthrough ON mode.
ScaleArc initially sends all the traffic in passthrough mode for half of the duration selected. For example, if the duration selected is one minute, then the traffic runs in passthrough mode for 30 seconds. After 30 seconds the cluster once again restarts and the traffic is sent through ScaleArc with passthrough mode OFF for the remainder of the test duration. An alert indicates when the cluster stops and restarts.
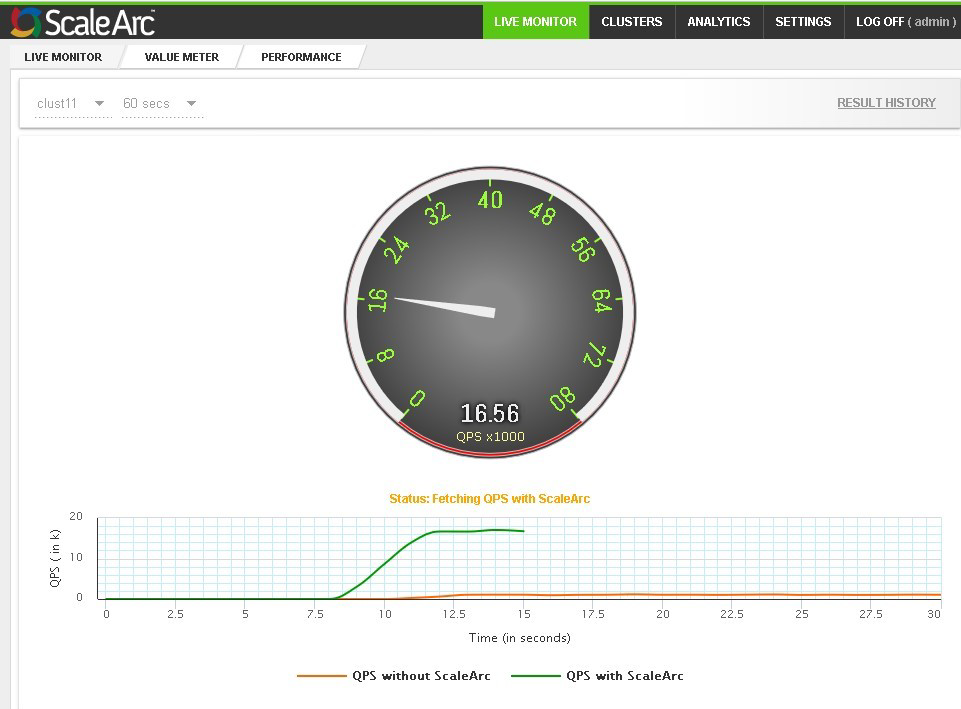
- View the results of the performance on the screen while traffic begins to pass through, without ScaleArc. The traffic dial displays the QPS traffic.
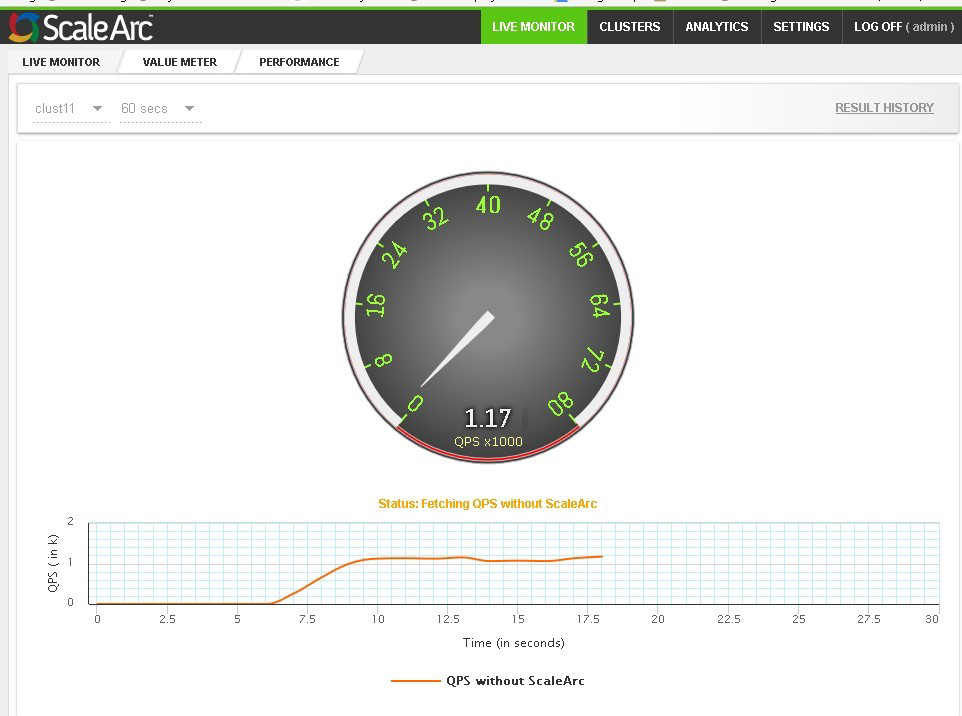
- Past 30 seconds in the selected example, the traffic dial displays QPS, with the traffic passing through ScaleArc. Compare both results (that is, traffic passing through with and without ScaleArc) in the graph below the traffic dial.
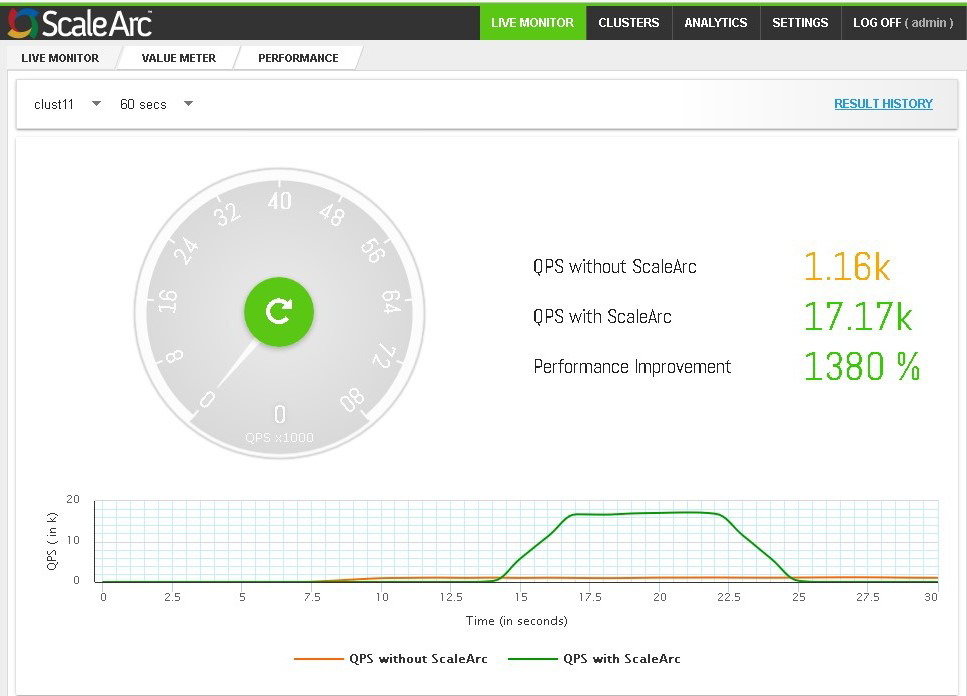
- On completion, the right side of the screen displays the final QPS results. Note the percentage of performance improvement in this display.
-
Click RESULT HISTORY to view previous performance tests conducted on the selected cluster. The graph displays the time the test was conducted, QPS results (in k) with/without ScaleArc, and percentage of performance improvement.
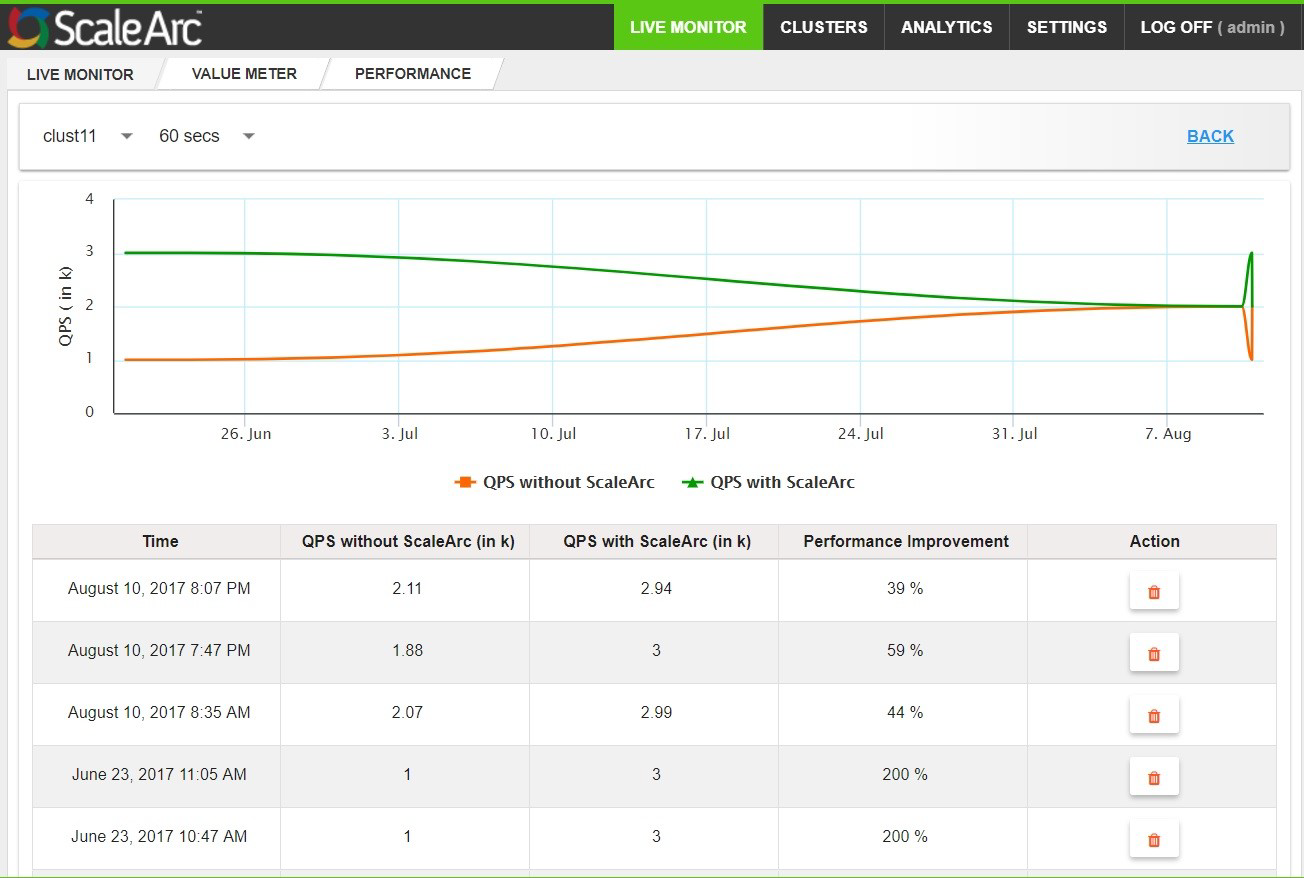
- To delete a previous result, use the Delete Action icon to remove a selected result.