
In this article, we walk through how to configure and use your ScaleArc software. If you do not yet have ScaleArc installed, either through the AWS Marketplace or a separate installation, return to that step before proceeding.
ScaleArc is database load balancing software that drops transparently between your application and the database. Deep integration with database platforms allows ScaleArc to reroute traffic during outages and queue writes and transactions during failovers. All of this happens transparently to your application and your users. All you will need to do is change the hostname in your database connection string.
With your application connected to a ScaleArc cluster, it can intelligently route traffic across the different nodes. Write transactions, such as SQL insert, update, and delete statements, are sent to the primary database node. Queries, or SQL select statements, are distributed across your read replicas. All of this happens transparently with zero changes required to your application code.
ScaleArc works with database clusters as well as individual databases. In this example, we will configure a ScaleArc cluster that uses an RDS Aurora MySQL cluster. The primary and read-only endpoints provided by RDS are used to define our ScaleArc cluster.
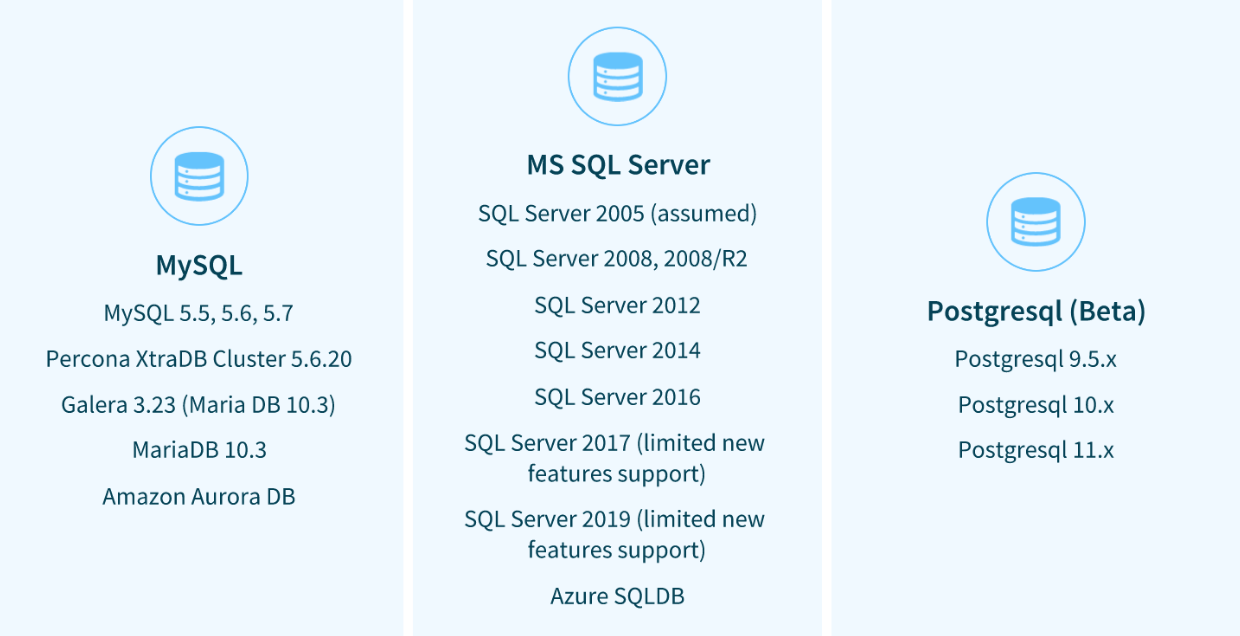
Note that the following platforms are supported for my MySQL and SQL Server. PostgreSQL support will be added in a future release.
Database Configuration
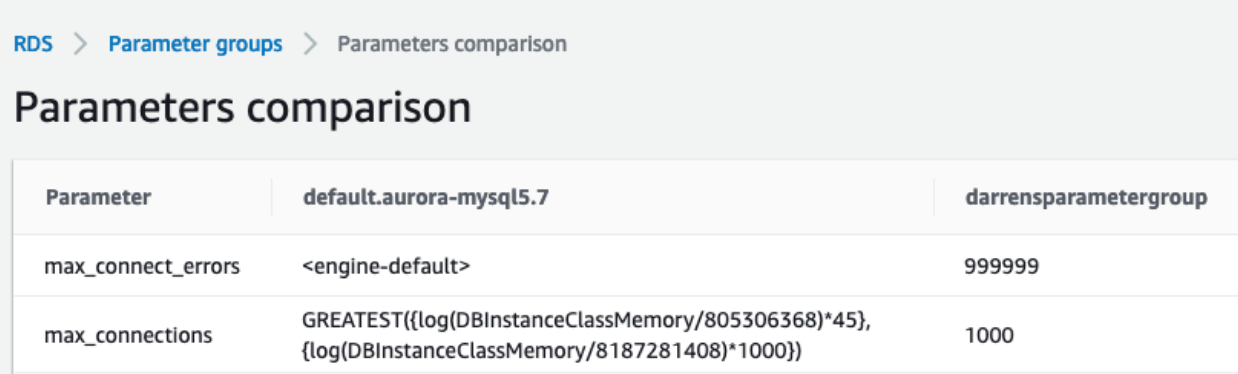
ScaleArc requires the configuration of a few parameters so that it can manage the connections for your database. For example, a new parameter group is created in RDS that adjusts the values for max connect errors and max connections. If you forget to do this, ScaleArc may return an error message when registering your database servers.
Make sure that your database client matches the version of your database server. In this article, we are using MySQL 5.7 database, thus we are also using the 5.7 client.
ScaleArc Architecture
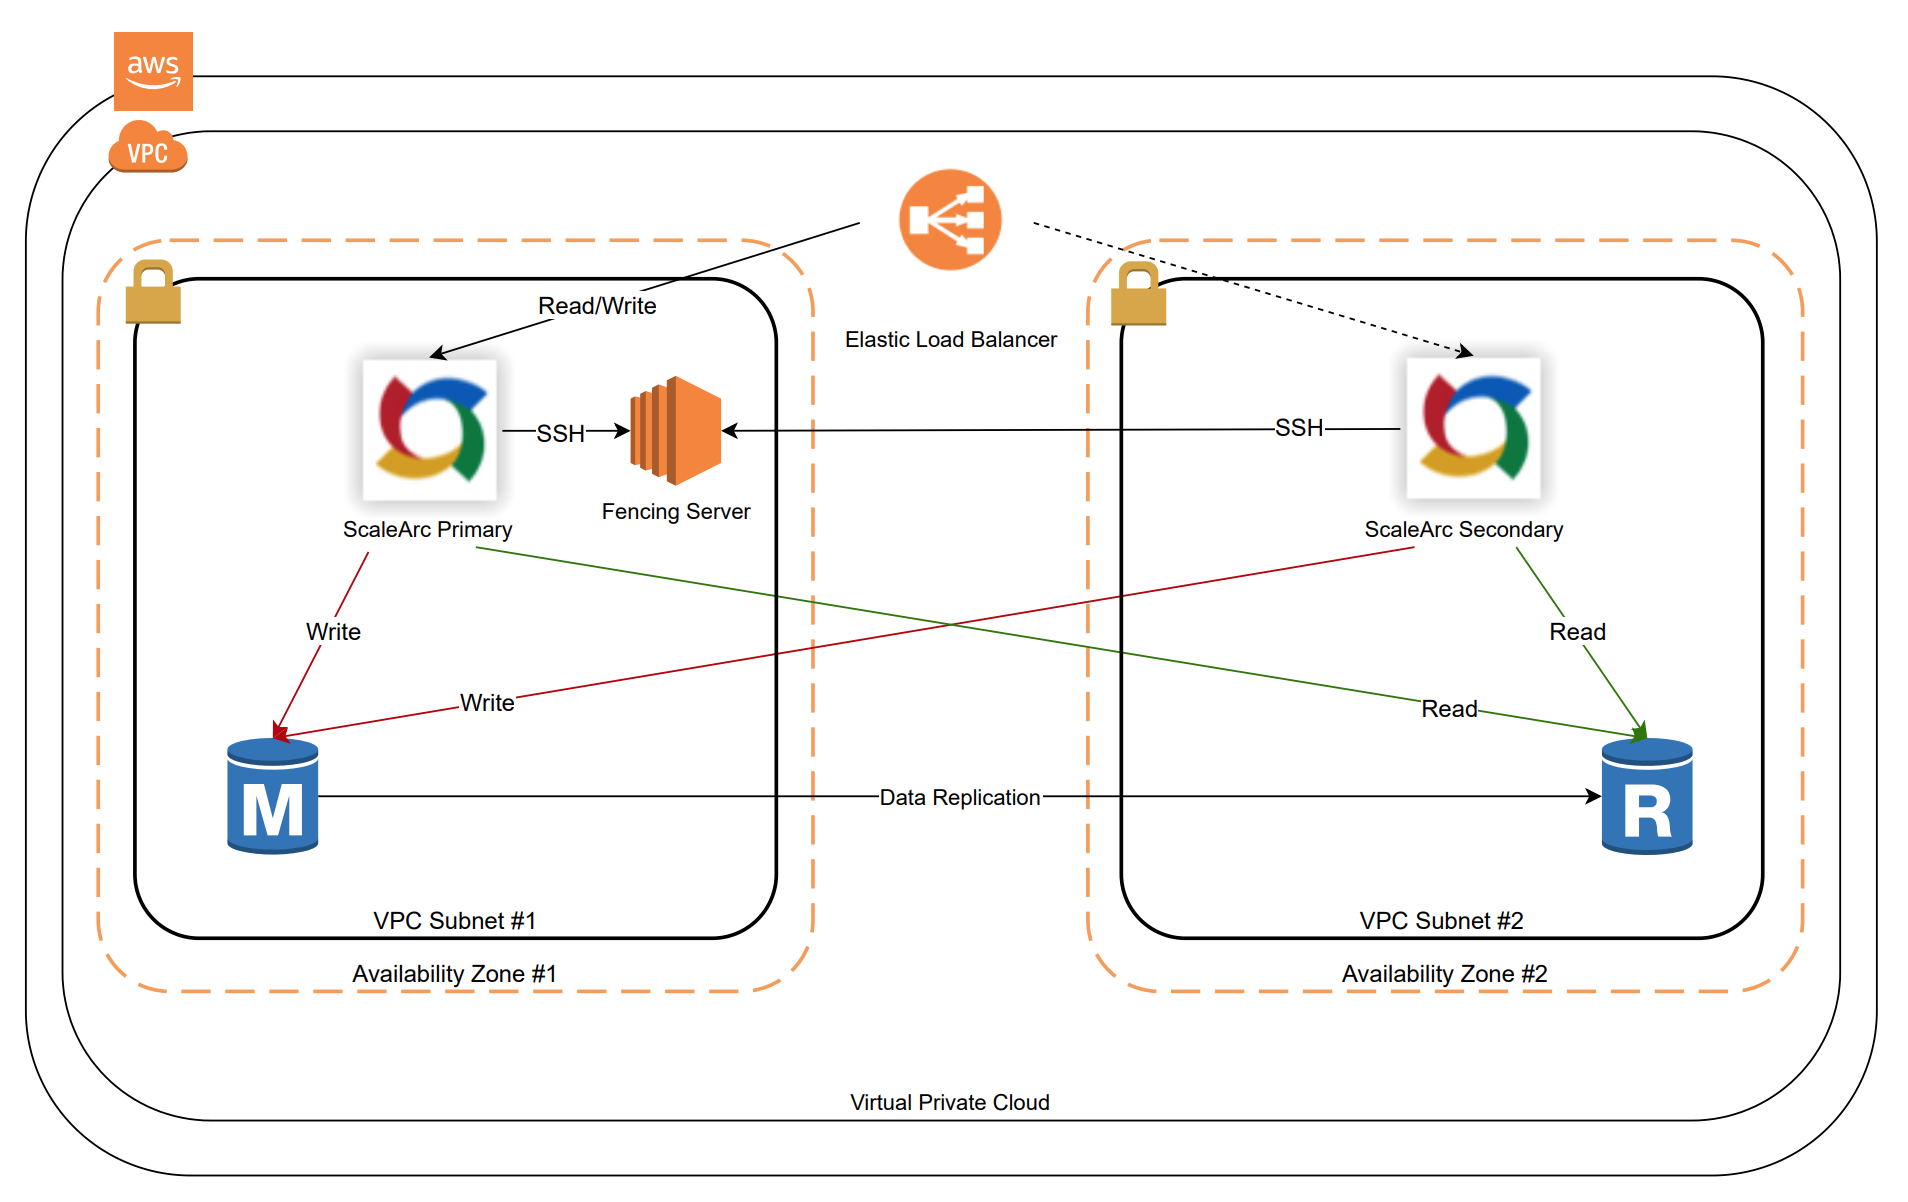
The overall architecture is shown below. This is what the AWS Marketplace installation will set up. If you are running from a separate installation, you will want to configure something similar to get a highly available solution.
There is a ScaleArc primary and secondary node, each in its own availability zone. Those are fronted by an Elastic Load Balancer (ELB). The ELB endpoint is used to manage your ScaleArc cluster from a browser. It is also used as the host in your database connection string. The fencing server is used to coordinate the state between the primary and secondary nodes.
The diagram here shows a single primary database node and just one read replica node. Your configuration may vary, but the same basic concepts apply.
Creating a ScaleArc Cluster
Browse to the endpoint or your ScaleArc installation and login using the credentials that you've been provided. You are greeted with a screen that prompts you to set up a ScaleArc cluster. Click on the Setup ScaleArc button and that takes you to the cluster creation screen.
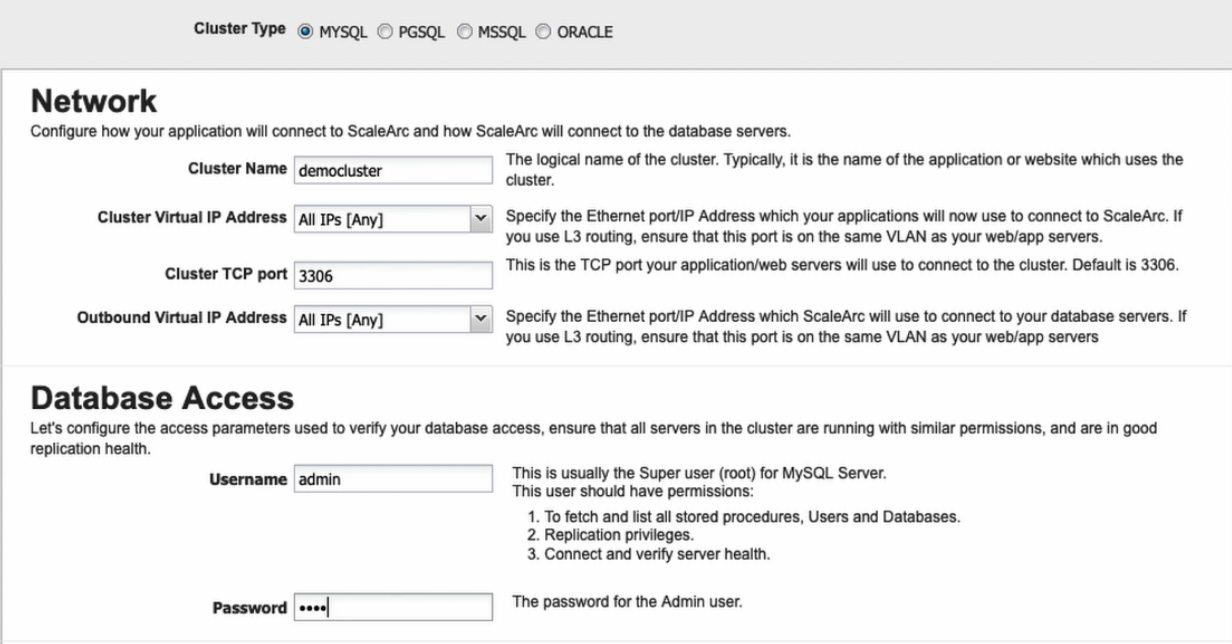
First, choose your database platform. Then provide a descriptive name for your cluster. Define which IP ports on the host to bind to this cluster. For this example, we are using MySQL and binding all inbound and outbound ports, and using the default port 3306.
Next, provide credentials for your database so that ScaleArc can log in and manage connections.
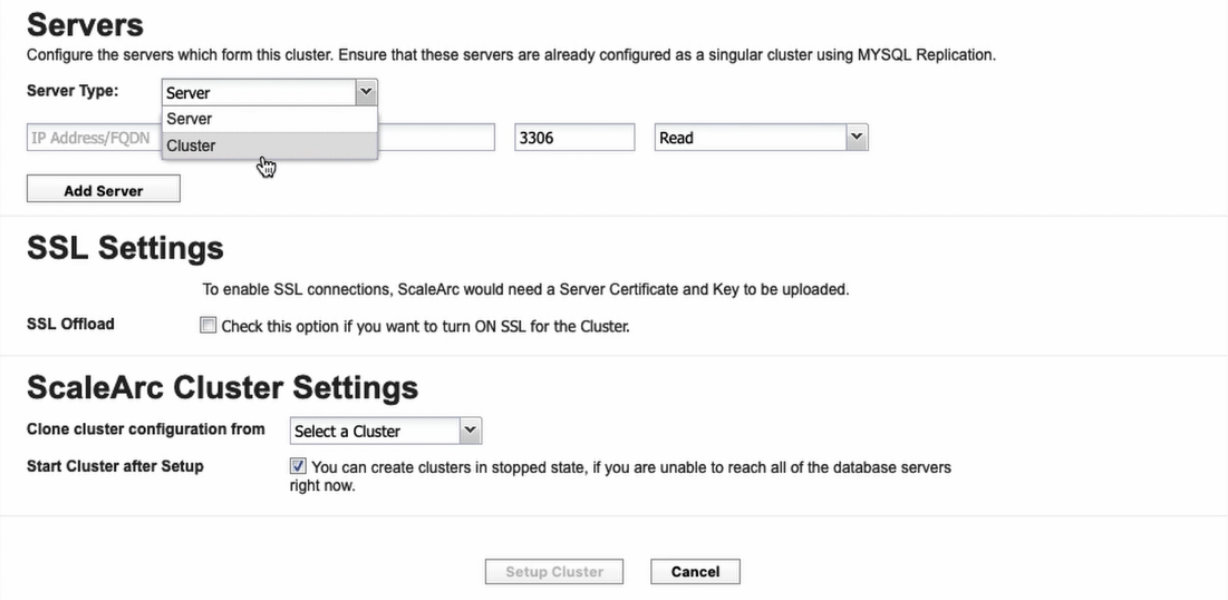
You can register database servers or a cluster. In this example, we are registering a cluster. Click the configure server button and enter in your AWS credentials. Provide the RDS cluster name as well. This allows ScaleArc to retrieve the database information and populate the form. Verify the information looks correct and then click the add button.
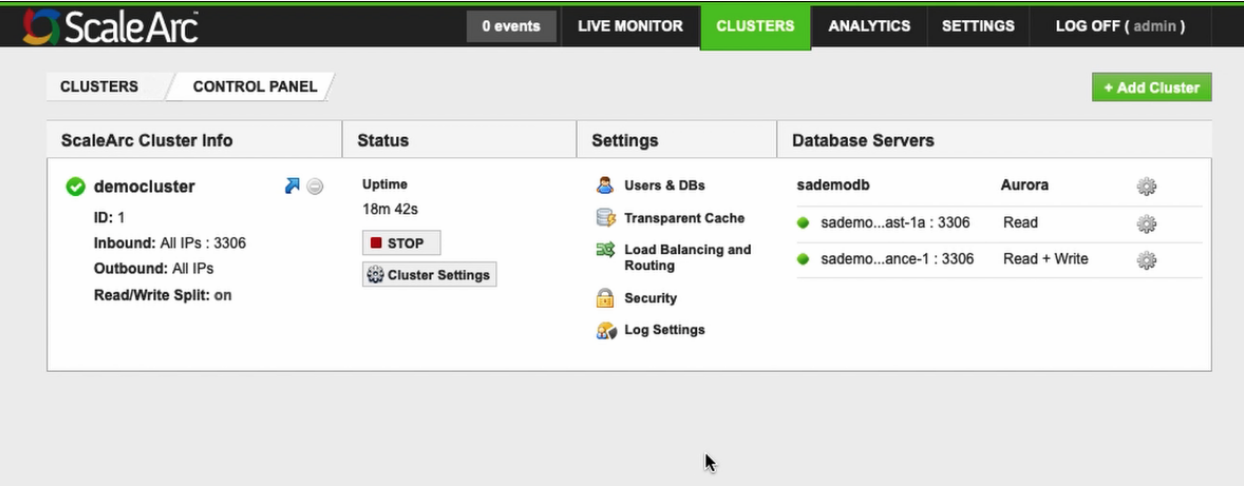
For this article, we will skip setting up SSL. At this point, we are ready to click the setup button. You can now view your cluster, see the basic status, and make other configuration changes to it.
Monitoring and Metrics
On the top menu navigate to Live Monitor and go to your cluster’s stats to see monitoring and metrics information. There are helpful graphs here that show the number of connections, cache usage, and the number of queries.
Initially, you may want to change the graphs to smaller units. This will make it easier to see activity taking place until you get to a more production-like scenario.
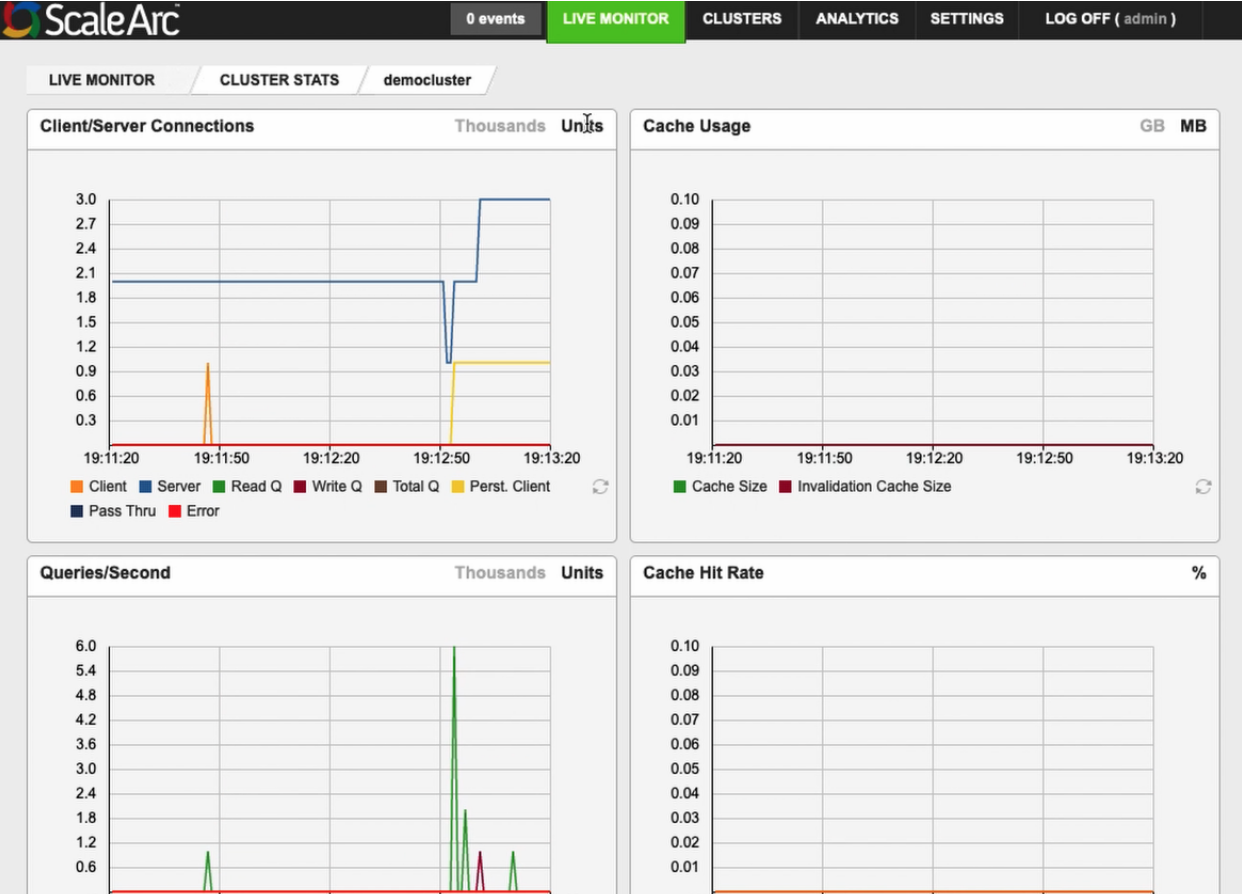
In order to see some information here, use your database client to run a query. You will replace the database hostname with the ScaleArc cluster hostname. After doing that, you should see some data in the connections, queries, and response time graphs.
Now you can create your first ScaleArc cluster and monitor the traffic. Using ScaleArc also enables you to conduct maintenance on one node while traffic is seamlessly rerouted to another node.
For more information, please visit our documentation page or our YouTube channel. And always feel free to reach out to us at scalearc-support@devgraph.com with any questions. Thank you for choosing ScaleArc.