
The ScaleArc ANALYTICS screen shows a near real-time view of SQL traffic and is designed to provide a simplified view of database traffic. Through each screen, administrators can drill down into each SQL to see exactly which queries are taking the most resources.
Analytics has an easy to use GUI which shows top consuming SQL and has the ability to compare SQL queries from different dates. In addition, SQL can be added directly to the cache from within the Analytics page.
Analytics landing page
Open the ScaleArc Analytics landing page by clicking on the ANALYTICS tab on the ScaleArc dashboard.
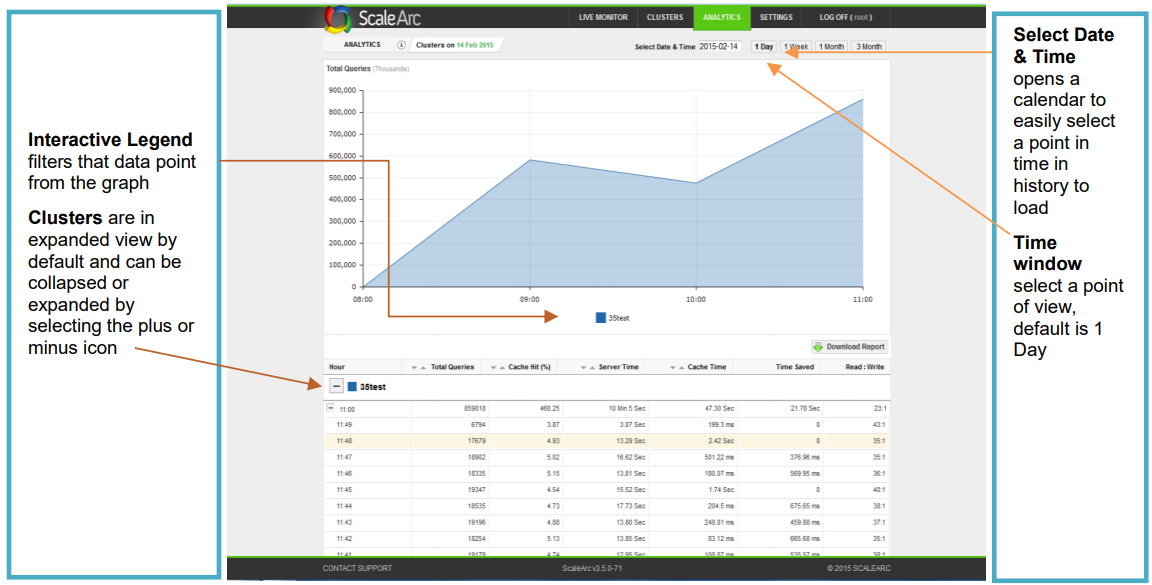
ScaleArc Analytics's landing page breaks out information by cluster, with graphs illustrating:
- transaction trends
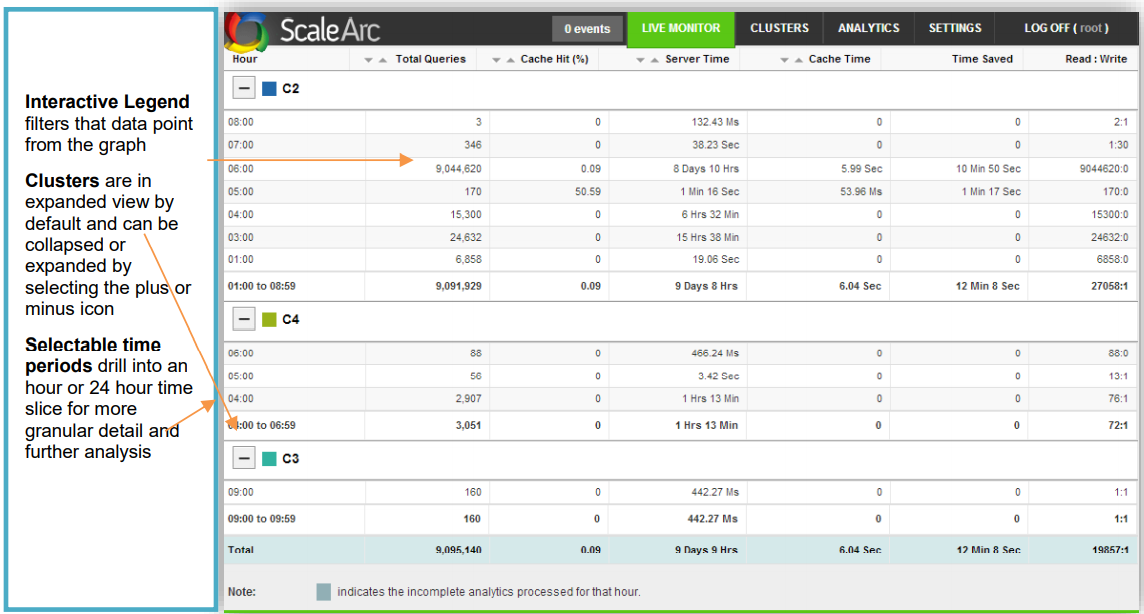
- report style totals for the 24-hour period that are expandable into one-hour time slices
- a date field for extending the illustration to historical data
- views that can be modified from one day, one week, a month, to three months, or a specific date and time
Additionally, using ScaleArc's Analytics screen, you can easily
- cache select query patterns to improve performance
- blacklist select queries to ensure database security and prevent DDoS attacks
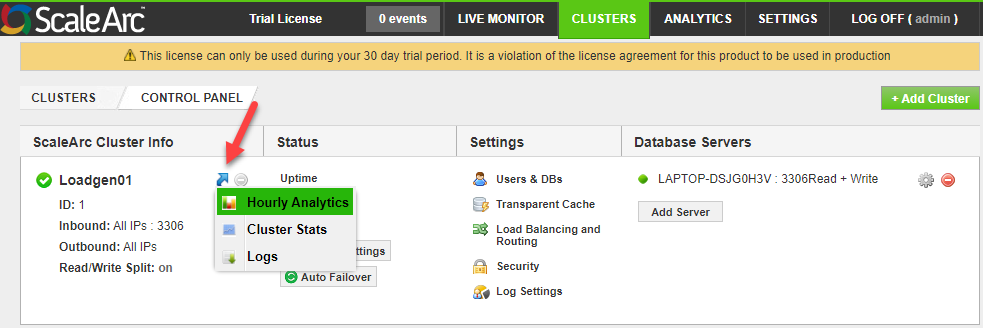
You can access the Hourly Analytics from the Cluster Control Panel.
Analytics Reports
ScaleArc provides a series of embedded screens so administrators can drill down into SQL queries to see exactly which ones are taking the most resources. Each analytics screen is divided into two halves: the top part displays a graph while the lower half displays a grid containing interactive elements.
For each cluster, you can conduct deep query analysis by clicking on the interactive elements on the screen. Using the Download Report button, you can extract and download a report for the time period under review.
Refer to the following sections to drill down the various analytics reports from the general view (Total cluster traffic analysis) to the more specific detailed analytics reports (Unique query analysis and Log search):