
The Cluster Control Panel within the ScaleArc dashboard is the central point for configuring and managing clusters.
The ScaleArc dashboard displays the newly-created cluster in a panel. Any additional clusters you create will appear on the dashboard; grouped by a panel for each cluster.
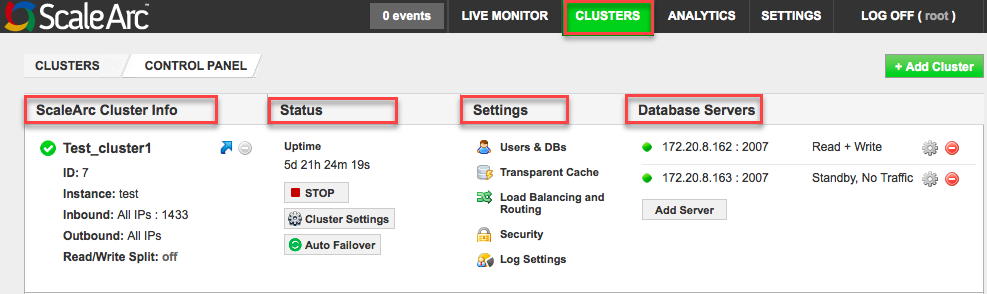
The Cluster Control Panel has four columns which are:
- ScaleArc Cluster Info represents cluster information (i.e., cluster name, system-generated cluster-ID, inbound, and outbound IP addresses; the outbound in this column indicates the route from ScaleArc to the database server).
- The Status column indicates the appliance uptime and also includes a button to Stop/Start the cluster as well as a shortcut to the Auto-Failover configuration screen.
- The Settings column provides configuration options for various ScaleArc components and product features including Users & DBs, Transparent Cache, Load Balancing & Routing, Security, and Log Settings.
-
The Database Servers column shows all the database servers in the cluster and includes a button to add servers if needed.
Refer to the linked articles for detailed information on the elements displayed under each column then review the different components displayed in the control panel by following these steps:
- Click on the CLUSTERS tab in the ScaleArc dashboard.
- Review the contents of the Control Panel taking note of the 4 columns. If you have created one or more clusters they will be shown on this screen.
- Explore the Add Cluster button to view the configuration screen for creating a cluster.
- Click on the various icons under the Settings column to open the corresponding screen i.e. Users & DBs, Transparent Cache, Load Balancing & Routing, Security, and Log Settings.
- Take note of the red icon next to a resource to delete the corresponding resource e.g. delete database server in the example shown below:
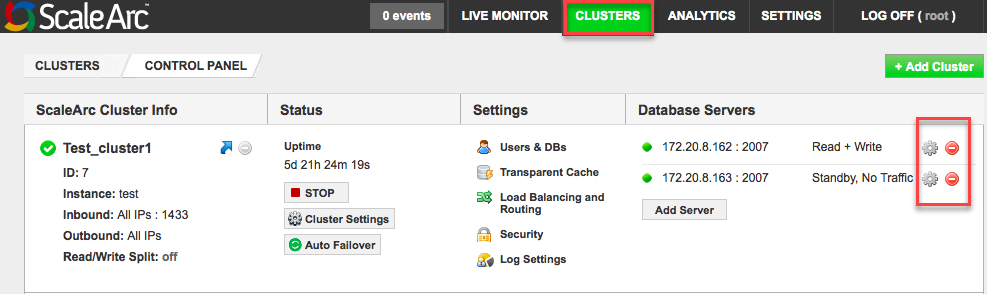
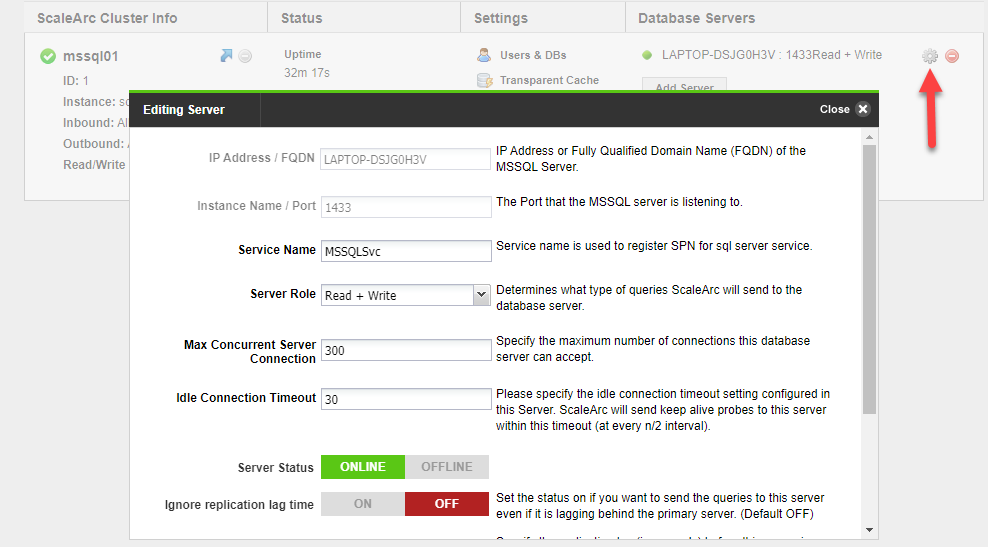
- Click on the Gear icon to access editing functions for a resource.
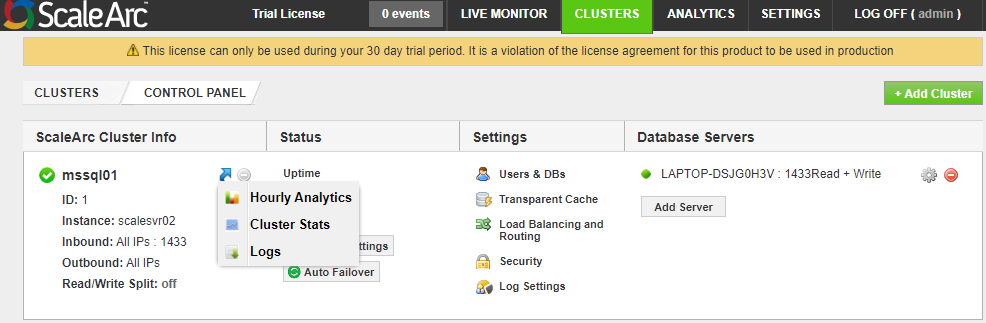
- Hover above the blue arrow in the ScaleArc Cluster Info column to access the quick links to Hourly Analytics, Cluster Stats, and Logs.
- You can manage the cluster attributes or delete the cluster by referring to Managing a Cluster.