
Overview
This article outlines the resolution steps to be followed when the Analytics graphs are not showing any data.
Diagnosis
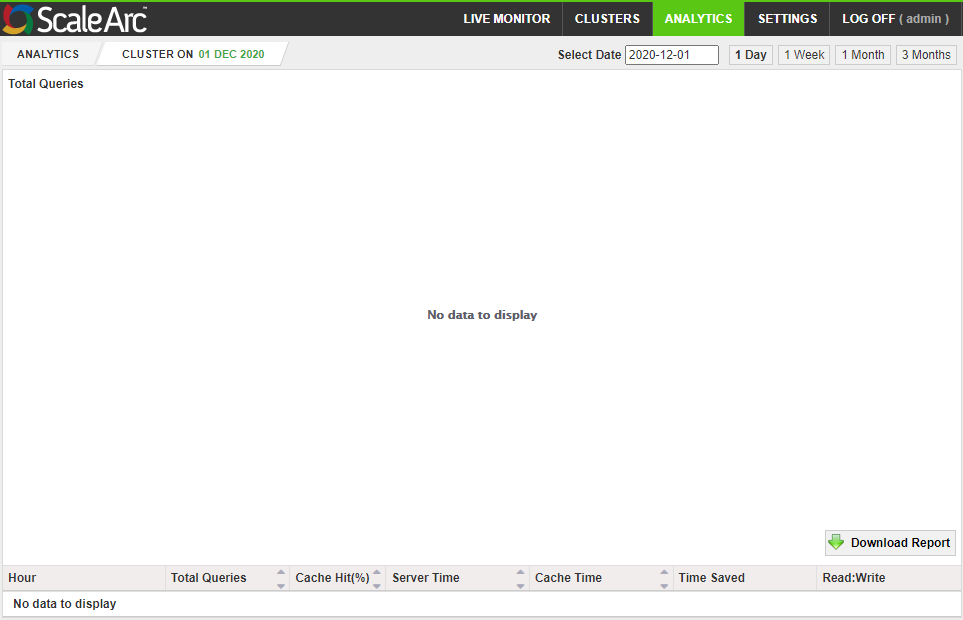
The ANALYTICS tab on the ScaleArc dashboard will be showing empty graphs and reporting there is No data to display as shown below:
Solution
Follow these steps to confirm that the Analytics service is running for ScaleArc to correctly display the various analytics graphs described in Using ScaleArc Analytics.
- Navigate to SETTINGS > System Settings > System Status tab and check the ScaleArc Commands section to confirm that global Analytics service has not been stopped. Presence of a button labelled Stop Analytics is an indication that global Analytics is running, otherwise start the service by clicking on the Start Analytics button as shown below:

Select Yes on the confirmation dialog when prompted: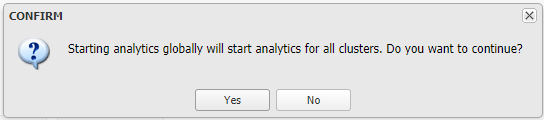
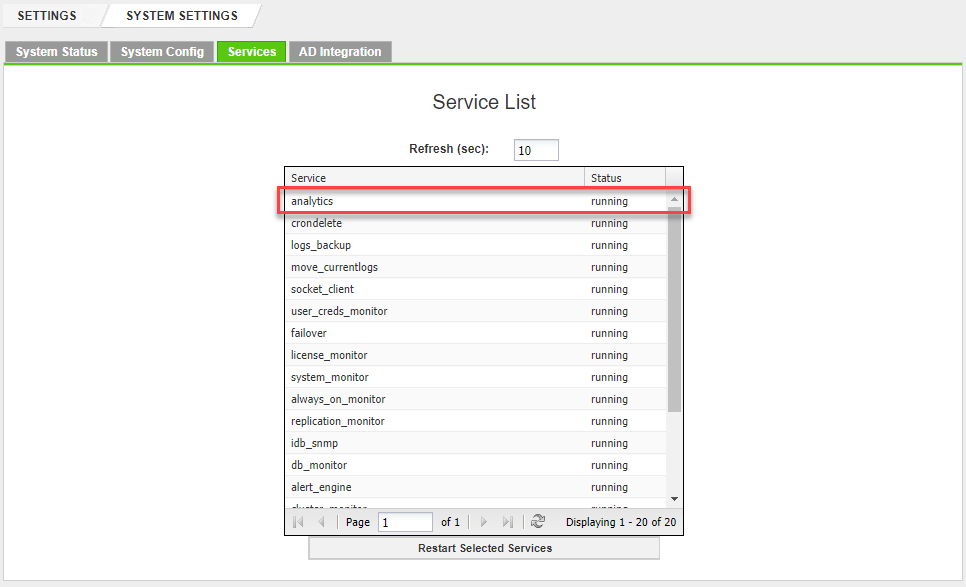
- Click on the Services tab and confirm from the status column that the analytics service is running:
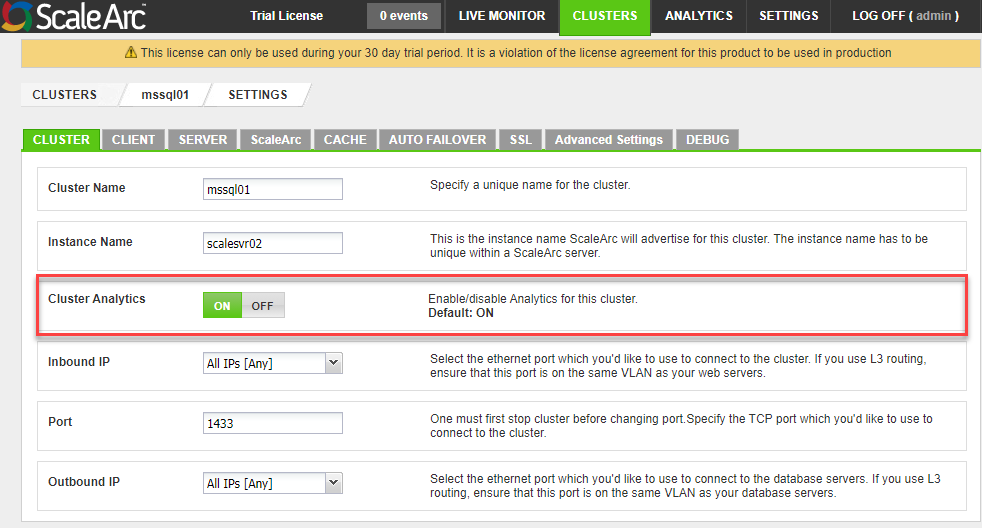
- Confirm that Cluster Analytics is set as ON in the Cluster Settings for each cluster by navigating to CLUSTERS > Cluster Settings > CLUSTER tab. Use the toggle switch to enable Analytics for the cluster if necessary.
Testing
Confirm that the Analytics graphs are now displaying correctly by navigating to the ANALYTICS tab in the ScaleArc dashboard:

Note: Use the Select Date filter to ensure that you are selecting a date for which you had traffic flowing through the ScaleArc appliance.
Comments
0 comments
Please sign in to leave a comment.