
Overview
The AlwaysOn Monitoring service tracks the roles and health of the database server by connecting to the primary instance first and getting the current roles of the database servers participating the AlwaysOn (AWO) Availability Group.
As part of its monitoring, it connects to one of the database servers during each health-check interval to get health and role information. If the connection to any of the member DB servers fails, the health of the Primary DB is marked as down (unhealthy) for that interval.
Diagnosis
Start by reviewing the ScaleArc logs in order to confirm the issue and root cause. Refer to this linked article for more information on Capturing ScaleArc Logs.
Sample log extracts are provided below:
From the log file idb.alert.17.2018071113:
2018-07-11 13:14:10 CID: 17, Client IP: , User: Unknown, Debug_Code: 525, Message: HEALTH ALERT :
Failed to execute encryption property query for server (10.16.9.192:1433), State: -1, SSID: 0, DB: , DB IP: , Type: 37

2018-07-11 13:14:10 CID: 17, Client IP: , User: Unknown, Debug_Code: 525, Message: HEALTH ALERT :
AlwaysON service reported health down for (DZSQL18:1433). Marking DB server health down.
(While processing failover command), State: -1, SSID: 0, DB: , DB IP: , Type: 37

2018-07-11 13:14:10 CID: 17, Client IP: , User: Unknown, Debug_Code: 525, Message: HEALTH ALERT :
Health is down for (DZSQL18:1433) for cluster (id:17) inbound(10.16.9.85:1433) (No connections attempted) :
Reason : AlwaysON service reported DB server health down., State: -1, SSID: 0, DB: , DB IP: , Type: 37

2018-07-11 13:14:11 CID: 17, Client IP: , User: Unknown, Debug_Code: 525, Message: HEALTH ALERT :
Health is down for (DZSQL18:1433) for cluster (id:17) inbound(10.16.9.85:1433) (No connections attempted) :
Reason : AlwaysON service reported DB server health down., State: -1, SSID: 0, DB: , DB IP: , Type: 37

2018-07-11 13:14:12 CID: 17, Client IP: , User: Unknown, Debug_Code: 525, Message: HEALTH ALERT :
Health is down for (DZSQL18:1433) for cluster (id:17) inbound(10.16.9.85:1433) (No connections attempted) :
Reason : AlwaysON service reported DB server health down., State: -1, SSID: 0, DB: , DB IP: , Type: 37
From db_monitor.log.1:
2018-07-11 13:14:17,905 INFO Health status is down
2018-07-11 13:14:17,905 ERROR Set health error: (0, u'Server DZSQL18 is not healthy, db_lag value noted is 0.
Please contact support at support@scalearc.com')

2018-07-11 13:14:17,905 INFO Going to publish on channel 'db_health':
{'status': 'UP', 'ident': '17_1', 'cid': 17, 'ipaddr': u'DZSQL18', 'db_id': 1,
'message': u'Alert: Database (DZSQL18:1433) health is marked UP\r\n', 'port': 1433, 'subject': 'Database is UP'}

2018-07-11 13:14:17,910 INFO Database 1, IP: DZSQL18 is healthy (From Core)
From cluster_monitor.log:
2018-07-11 13:14:22,347 INFO ClusterMonitor(17): Started Monitoring for cluster where type is MSSQL

2018-07-11 13:14:22,348 INFO ClusterMonitor(17): Cluster Info is {'ssl_enabled': False, 'inbound_ip': u'10.16.9.85',
'clustername': u'NAEP_TEST', 'ssl_verify_server': False, 'use_kerberos': 0, 'ssl_enable_client': False,
'outbound_ip': u'10.16.9.85', 'ssl_verify_client': False, 'inbound_port': 1433, 'outbound_port': 1433} and type is MSSQL

2018-07-11 13:14:22,351 INFO ClusterMonitor(17): Response from get_server_status is LB|17
DB|1|2
DB|2|2
DB|3|2
DB|4|2

2018-07-11 13:14:22,351 INFO ClusterMonitor(17): Read Write Server is [{'serverid': 1, 'ipaddress': u'DZSQL18', 'port': 1433}] and Health is True
2018-07-11 13:14:22,351 INFO ClusterMonitor(17): Failover is running False
2018-07-11 13:14:22,351 INFO ClusterMonitor(17): Verify Cluster Monitor Request and result is True
2018-07-11 13:14:22,352 INFO ClusterMonitor(17): Started Cluster Monitor using query
2018-07-11 13:14:22,352 INFO ClusterMonitor(17): Connection and Execute a query for cluster type MSSQL
2018-07-11 13:14:22,354 INFO Connection String is DRIVER={FreeTDS};SERVER=10.16.9.85;PORT=1433;TDS_VERSION=7.3;
UID=datazone\scalearc_admin;Trusted_Connection=no;UseNTLMv2=yes;Database=master;PWD=<passwd>;

2018-07-11 13:14:22,356 INFO Kerberos Flag for cluster is 0
2018-07-11 13:14:22,364 INFO ClusterMonitor(17): Mssql Query 'select /* Cluster Monitor Query MSSQL */ 1' Executed Successfully
2018-07-11 13:14:22,365 INFO ClusterMonitor(17): Done query execution and result is True
2018-07-11 13:14:22,365 INFO ClusterMonitor: Sleeping for 120 seconds
2018-07-11 13:16:22,467 INFO ClusterMonitor: All Clusterids and their types are :[(2, u'MSSQL', 0), (8, u'MSSQL', 1),
(12, u'MSSQL', 5), (13, u'MSSQL', 1), (17, u'MSSQL', 1)]

2018-07-11 13:16:22,467 INFO ClusterMonitor: Running Clusters ids are [8, 13, 17]
Finally, from the AlwaysOnMonitor.log we find:
2018-07-11 14:39:14,408 INFO AlwaysOnMonitor(17): Will try to use server : DZSQL24
2018-07-11 14:39:14,408 INFO Connection String is DRIVER={FreeTDS};SERVER=10.16.9.191;PORT=1433;TDS_VERSION=7.3;UID=datazone\scalearc_admin;
timeout=2;Trusted_Connection=no;UseNTLMv2=yes;PWD=<passwd>;

2018-07-11 14:39:14,411 INFO Kerberos Flag for cluster is 0
2018-07-11 14:39:14,444 INFO AlwaysOnMonitor(17): Exit from resolve check
2018-07-11 14:39:15,445 INFO AlwaysOnMonitor(17): *Start* Retrieving latest server stats
2018-07-11 14:39:15,445 ERROR AlwaysOnMonitor(17): Problem determining current master:
('42000', '[42000] [FreeTDS][SQL Server]The user does not have permission to perform this action. (297) (SQLExecDirectW)')

2018-07-11 14:39:15,446 INFO AlwaysOnMonitor(17): Got the old primary server who's server id is 1 and ip is DZSQL18
2018-07-11 14:39:15,451 INFO AlwaysOnMonitor(17): Writeback to sqlite  for changes
2018-07-11 14:39:15,451 INFO AlwaysOnMonitor(17): Sending msg to core: always_on_failover|17|1:0:1:0|
And also:
2018-07-11 14:39:13,147 INFO AlwaysOnMonitor(17): Will try to use server : DZSQL25
2018-07-11 14:39:13,147 INFO Connection String is DRIVER={FreeTDS};SERVER=10.16.9.192;PORT=1433;TDS_VERSION=7.3;
UID=datazone\scalearc_admin;timeout=2;Trusted_Connection=no;UseNTLMv2=yes;PWD=<passwd>;

2018-07-11 14:39:13,151 INFO Kerberos Flag for cluster is 0
2018-07-11 14:39:13,207 INFO AlwaysOnMonitor(17): *Start* Retrieving latest server stats
2018-07-11 14:39:13,208 ERROR AlwaysOnMonitor(17): Problem determining current master:
('42000', '[42000] [FreeTDS][SQL Server]The user does not have permission to perform this action. (297) (SQLExecDirectW)')

2018-07-11 14:39:13,209 INFO AlwaysOnMonitor(17): Got the old primary server who's server id is 1 and ip is DZSQL18
2018-07-11 14:39:13,334 INFO AlwaysOnMonitor(17): Writeback to sqlite  for changes
2018-07-11 14:39:13,334 INFO AlwaysOnMonitor(17): Sending msg to core: always_on_failover|17|1:0:1:0|
Increasing debug level
In order to see more detailed information on the errors, enable debugging logs for the AlwaysOn monitoring service by following these steps:
- Edit the file
/opt/idb/conf/logging.confin an SSH session. - Change the debug level setting to DEBUG in the
logger_always_on_monitorsection:#########################################################################
# ALWAYS_ON_MONITOR-related loggers
#########################################################################
[logger_always_on_monitor]
level=DEBUG
handlers=always_on_monitor
propagate=1
qualname=always_on_monitor
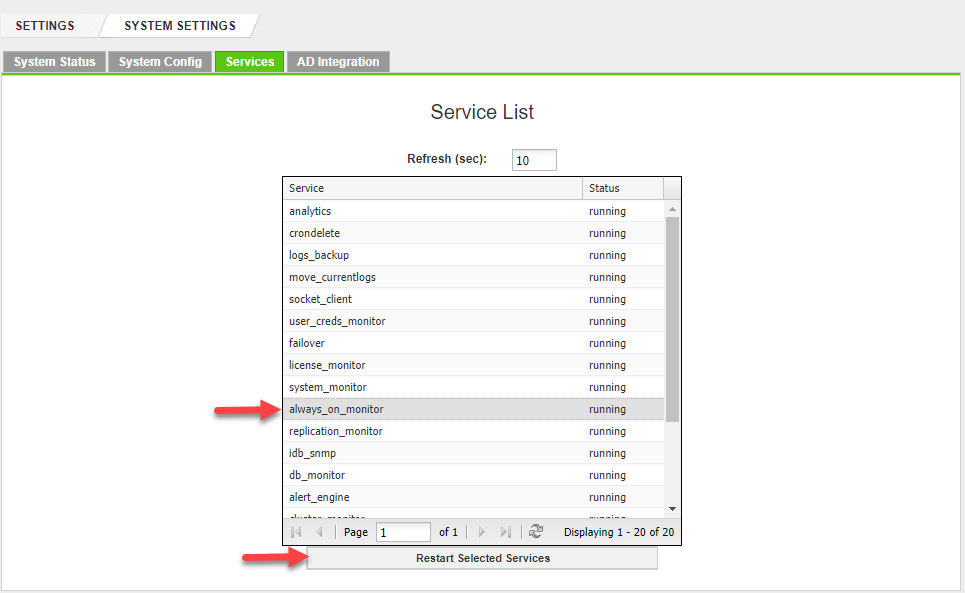
######################################## - Restart the AlwaysOn monitoring service from ScaleArc UI, by navigating to SETTINGS > System Settings > Services tab, selecting the service (always_on_monitor) and clicking on the Restart Selected Services button.
Solution
Upon establishing that there is a problem getting the AlwaysOn information from one of the member servers in the AWO cluster, then either the DB user is not granted permission or the configuration is not correct.
Follow these steps to verify and resolve the permissions issue:
- Using command
sqlcmdfrom the ScaleArc server, connect to all the database servers with the credentials used by the AlwaysOn monitor as shown in the following log entry:TDS_VERSION=7.3;UID=datazone\scalearc_admin;timeout=2;Trusted_Connection=no;UseNTLMv2=yes;PWD=<passwd>;
- Once connected, run the following SQL queries:
SELECT endpoint_url FROM sys.availability_replicas
WHERE replica_server_name = (SELECT primary_replica
                             FROM sys.dm_hadr_availability_group_states);
GO;

SELECT replica_server_name,primary_role_allow_connections_desc, secondary_role_allow_connections_desc
FROM sys.availability_replicas;
GO;

SELECT endpoint_url,primary_role_allow_connections_desc, secondary_role_allow_connections_desc
FROM sys.availability_replicas;
GO; - If the above queries fail, proper permission needs to be granted to allow monitoring, which should resolve the database flapping/unstable database health issue.
- Alternatively, the attached script
connection_test.pycan be used to verify the permission issue. Follow these steps to run the script:- Download and edit the file to include the Server IPs and password in the
PWDvariable. E.g.PWD="abcd@123" - Copy the script file to the ScaleArc machine, using an SFTP client into the
/home/idbdirectory. - Run the below command from an SSH session on the ScaleArc machine:
python connection_test.py
- Download and edit the file to include the Server IPs and password in the
Any identified user lacking permissions should be granted by referring to Minimum User Permissions Required for MSSQL Cluster.
- If the problem is incorrect configuration, review Configuring AlwaysOn Server for detailed information on the steps to set up an AlwayOn cluster in ScaleArc.
Comments
0 comments
Please sign in to leave a comment.