
Overview
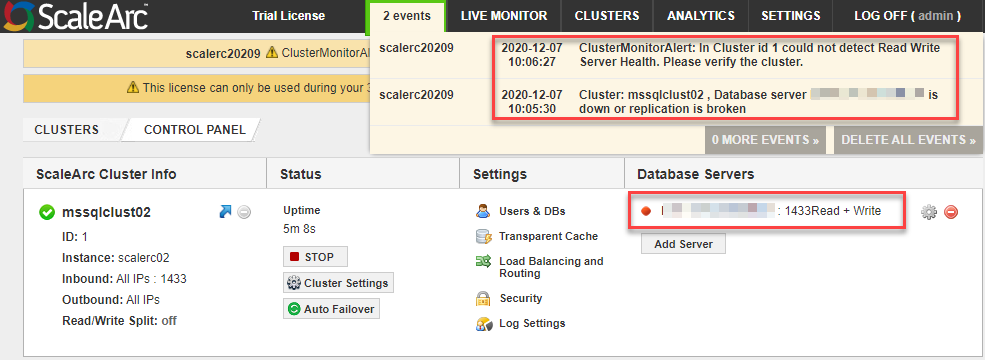
Network communication breakdown between ScaleArc and the database servers can result in ScaleArc cluster monitor alerts stating that the database servers are down and that the server health could not be detected.
When this happens, the affected servers are unable to process any traffic even when the database servers are confirmed to be running.
Solution
ScaleArc triggers PING checks when some actions are performed, for example when creating a cluster or adding query route rule patterns. Unsuccessful PING will result in the target database server being marked as unhealthy by the cluster monitor and accordingly stopped from processing SQL traffic.
This, therefore, means that ICMP (Internet Control Message Protocol) traffic must be allowed between ScaleArc and all the database servers added to a ScaleArc cluster.
Follow the steps below for diagnosis and resolution when this issue is encountered:
- Confirm that a network path exists between ScaleArc and the affected database servers by executing the
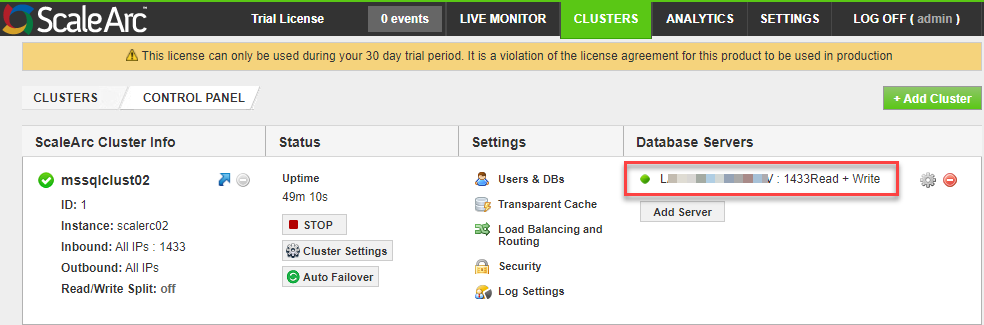
pingcommand from an SSH session on the ScaleArc server. Ping the hostname or IP address that is indicated in the Database Servers column on the ScaleArc dashboard.
Unsuccessful name resolution: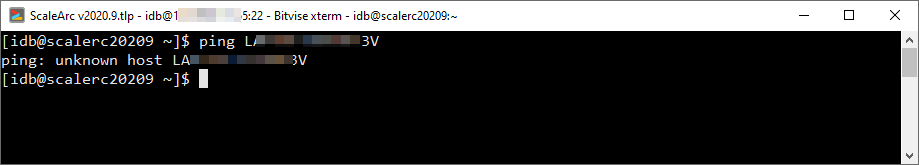
Successful name resolution but unsuccessful ping: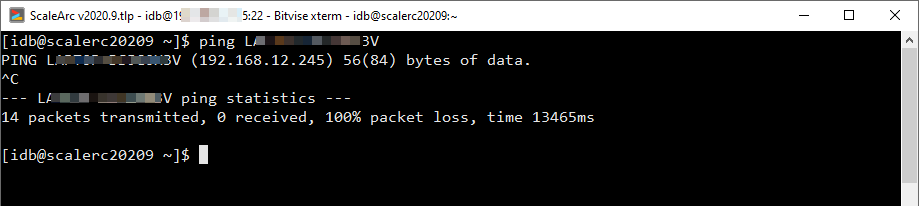
- Correct any name resolution errors by adding the required entries in
/etc/hostsas described in Configuring Local DNS Entries.
- Ensure that any firewalls in the network path between ScaleArc and the database servers allow ingress and egress ICMP traffic to/from the database servers and that the PING command returns a successful response as shown below.
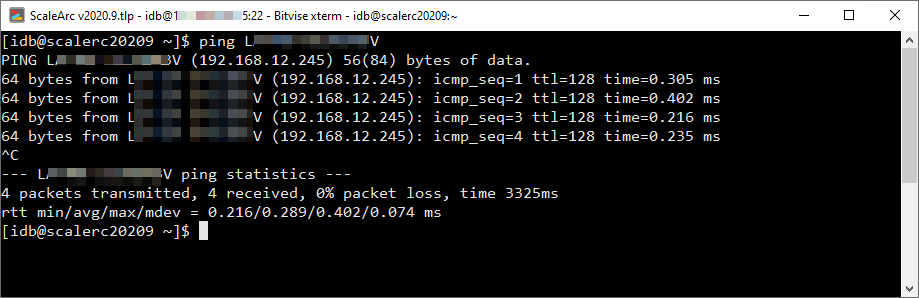
- Click on the CLUSTERS tab on the ScaleArc dashboard to view the cluster status after confirming successful PING.
Testing
Once ICMP traffic is enabled, the ScaleArc cluster monitor should automatically refresh the server health and change the status to green from red indicating that the cluster is up and ready to receive traffic:
Comments
0 comments
Please sign in to leave a comment.