
Overview
The ScaleArc services are designed to generate crash/core dumps any time there is a catastrophic fault affecting the normal operation of the service. These core dumps are written to disk for use in troubleshooting and issue resolution.
This article provides the instructions to obtain the core dumps when ScaleArc gives a notification that the system has encountered an issue that requires analysis.
Prerequisites
Environment:
ScaleArc version 3.8 until 3.11.0.2.
Information
Customers may receive a new email notification or a new alert notification in the ScaleArc UI with the following message: "ScaleArc recently encountered an issue that requires analysis. Please collect the relevant logs (debuglogs.core.xxxx.xxxxxxxxxxx.tar.gz) and send it to ScaleArc support. If you need any assistance, please email support@scalearc.com. Thank you."

This is normally an indication that core dumping has occurred on the ScaleArc server and further analysis should be carried out to determine the root cause.
The ScaleArc core dumps can be obtained by following these steps:
- Open ScaleArc > Live Monitor > Diagnostics > File Browser.
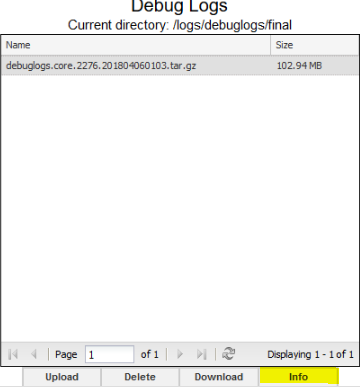
- Select the debug log file and click on the Info button.
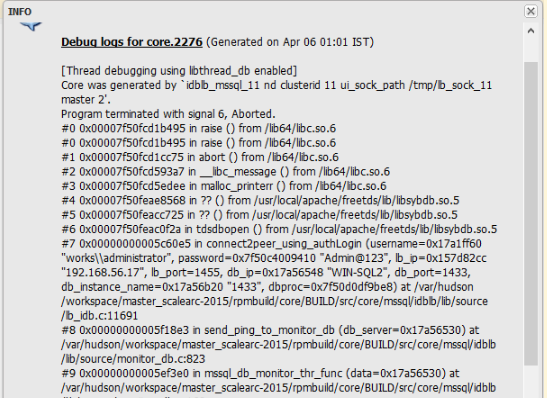
- Copy all the content of the Info window and send it as an attachment in a text file.
- Download the debuglogs.core.xxxxxxx.tar.gz file using the Download button.
- Send the file to ScaleArc Support for analysis through SFTP.
Related Articles
Comments
0 comments
Please sign in to leave a comment.