
Overview
This article outlines the procedure to identify which process is causing ScaleArc to have high memory utilization and the recommended resolution steps to restore normal utilization.
Solution
You can identify which process is causing ScaleArc to use high memory, from the System Stats, Historical Stats, or from an SSH session to the ScaleArc server using the topcommand.
Follow the steps below to identify and clear out the process or processes causing high resource utilization on the ScaleArc instance:
- Review the ScaleArc resource utilization (CPU, Memory, and Swap space) using any of the methods suggested above.
- Look out for any health monitor alerts related to memory utilization thresholds being exceeded and use the Historical Stats graphs to get more information on the cause.
- Use the
topcommand from an SSH session to view the currently running processes and their resource utilization. Processes taking up the high resource utilization will be listed at the top. - If any ScaleArc processes (e.g.
httpd) are observed to be having high memory utilization, restart theidbwebservice by executing the following commands from the SSH session:
service idbweb stopservice idbweb start
- After the service restart, CPU and memory utilization should return to the normal range. Below is a sample output from the
topcommand showing normal resource utilization: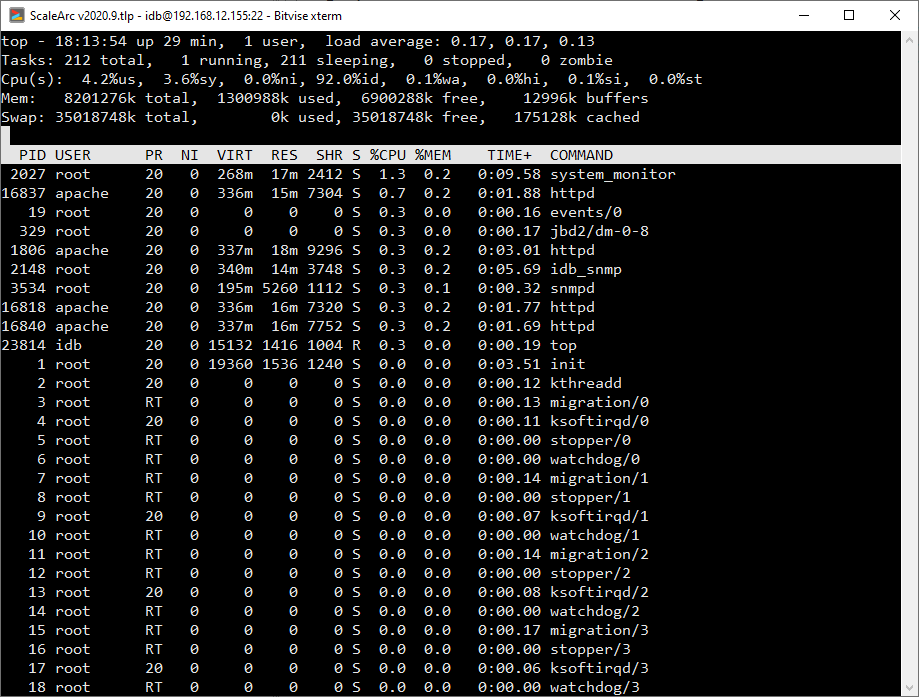
- It is recommended that you should upgrade ScaleArc to the latest build at all times so as to benefit from bug fixes and improvements that are continuously done to address some known issues in older versions.
Comments
0 comments
Please sign in to leave a comment.