
Overview
ScaleArc users can sometimes experience performance degradation accompanied by high CPU utilization (usually 100%) by the ScaleArc System (SYS) threads. This article describes the cause and recommended solution when this problem is encountered.
The CPU Distribution screen illustrates how the total number of ScaleArc processes are distributed among the available CPU cores. You can also view the status, memory utilization, and total CPU utilization per cluster as well as utilization across the various CPU cores.
Launch the CPU Distribution screen by navigating to SETTINGS > CPU Distribution from the ScaleArc dashboard to check whether the performance degradation is a result of ScaleArc threads or other processes outside ScaleArc.
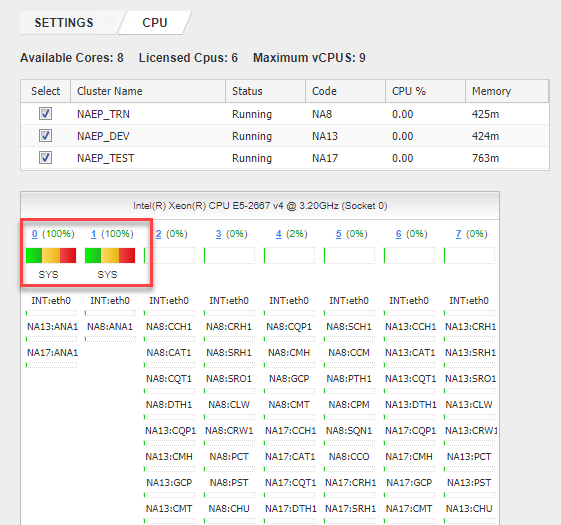
Sustained 100% CPU utilization, as shown above, signifies the cause is within ScaleArc and you should therefore proceed to the solution section for the next steps in resolving the issue.
Solution
The httpd processes of the idbweb service that run the ScaleArc UI will hog CPU time for extended periods when there are multiple child processes hung trying to open the same cluster configuration database files. The httpd processes correspond to the SYS cores observed on the CPU distribution page.
The idbweb service is responsible for spawning the UI httpd processes and should be restarted to resolve the high CPU utilization issue by following these steps:
- Log on to the ScaleArc instance via SSH. Refer to How to Enable SSH access to ScaleArc if SSH access to the appliance is currently disabled.
- Execute the following commands from the console terminal:
sudo service idbweb stop-
sudo service idbweb start
-
- The above commands can be run at any time and do not affect the cluster traffic.
- The UI processes and CPU utilization should revert to normal after the service restart.
- If in addition to the high CPU utilization you also experience frequent configuration lock errors in the UI or actions taking long or failing to complete, this is an indication of failing requests to the backend. You can release the lock by using the RESET Configuration Lock button in SETTINGS > System Settings > System Config tab. This step is applicable if you encounter the error
Operation failed. Database is lockedwhich occurs when the system does not release a lock on an internal database table.
Testing
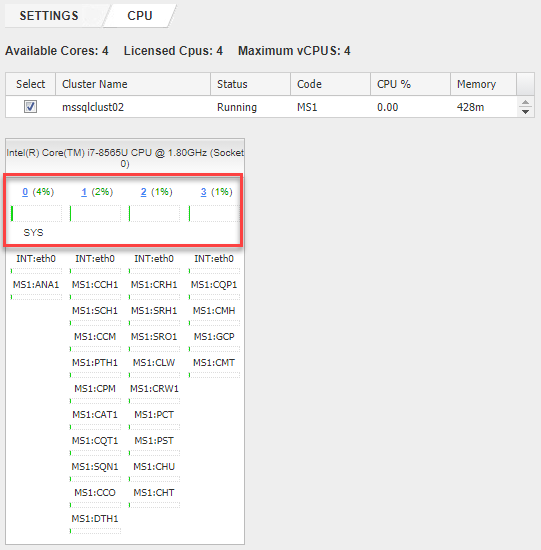
Open the CPU Distribution screen to confirm that the CPU utilization has reverted to normal range after the service restart.
Healthy CPU distribution should have utilization evenly distributed across the available CPUs without any one particular CPU flagged as overutilized.
Comments
0 comments
Please sign in to leave a comment.